Getting Started with Tableau
Build in-demand skills in Tableau Desktop, review the tool’s user interface and basic functionality, and discuss how to connect to data and ensure it is properly prepared for analysis.
Application requires an environment for practice as a first step toward efficacy. This chapter shifts the focus from theory to implementation as we briefly explore the different products contained within the Tableau application suite, focusing on the Tableau Desktop 2022 user interface. We cover how to get started with Tableau Desktop, review the tool’s user interface and basic functionality, and discuss how to connect to data and ensure it is properly prepared for analysis. From here, you will be able to move on to the visual analytics process to curate visuals and create data dashboards and stories, while building skills and competencies in the market-leading data visualization tool most in demand by today’s employers.
While this text should not be approached as a user manual for Tableau, if you are already an intermediate Tableau user and familiar with the 2022 interface and Tableau terminology, you might want to skip this chapter and move on to Chapter 4, “Keeping Visual Analytics in Context.”
Using Tableau
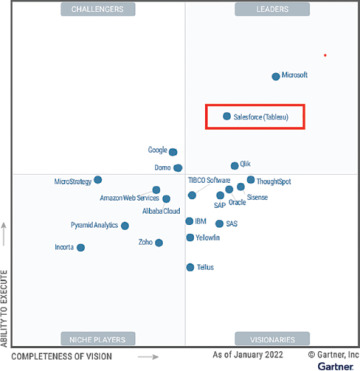
Acquired in June 2019 by Salesforce at a price tag of USD $15.7 billion in enterprise value,1 Tableau stands out against other data visualization tools on the market as the industry-leading, best-of-breed tool that delivers an approachable, intuitive environment for self-service users of all levels to prepare, analyze, and visualize their data. This software also provides delivery channels for the fruits of its users’ visual analysis, including dashboards and native storytelling functionality, called “story points” in Tableau. While focused on building a data-driven culture in analytics, Tableau boasts a robust and diverse data community, customer-focused innovation, an intuitive user experience, and an ever-growing catalog of enablement resources to support each of its products. As of 2022, Tableau had enjoyed a decade ranked as a Leader in Gartner’s Magic Quadrant™ for Analytics and Business Intelligence Platforms (Figure 3.1).

Figure 3.1 Tableau remains a Leader in the 2022 Gartner Magic Quadrant™.
Source: Gartner, March 2022.