This chapter is from the book
This chapter is from the book
This chapter is from the book
Big Data Analytics Lifecycle
Big Data analysis differs from traditional data analysis primarily due to the volume, velocity and variety characteristics of the data being processes. To address the distinct requirements for performing analysis on Big Data, a step-by-step methodology is needed to organize the activities and tasks involved with acquiring, processing, analyzing and repurposing data. The upcoming sections explore a specific data analytics lifecycle that organizes and manages the tasks and activities associated with the analysis of Big Data. From a Big Data adoption and planning perspective, it is important that in addition to the lifecycle, consideration be made for issues of training, education, tooling and staffing of a data analytics team.
The Big Data analytics lifecycle can be divided into the following nine stages, as shown in Figure 3.6:
- Business Case Evaluation
- Data Identification
- Data Acquisition & Filtering
- Data Extraction
- Data Validation & Cleansing
- Data Aggregation & Representation
- Data Analysis
- Data Visualization
- Utilization of Analysis Results
)
Figure 3.6 The nine stages of the Big Data analytics lifecycle.
Business Case Evaluation
Each Big Data analytics lifecycle must begin with a well-defined business case that presents a clear understanding of the justification, motivation and goals of carrying out the analysis. The Business Case Evaluation stage shown in Figure 3.7 requires that a business case be created, assessed and approved prior to proceeding with the actual hands-on analysis tasks.
)
Figure 3.7 Stage 1 of the Big Data analytics lifecycle.
An evaluation of a Big Data analytics business case helps decision-makers understand the business resources that will need to be utilized and which business challenges the analysis will tackle. The further identification of KPIs during this stage can help determine assessment criteria and guidance for the evaluation of the analytic results. If KPIs are not readily available, efforts should be made to make the goals of the analysis project SMART, which stands for specific, measurable, attainable, relevant and timely.
Based on business requirements that are documented in the business case, it can be determined whether the business problems being addressed are really Big Data problems. In order to qualify as a Big Data problem, a business problem needs to be directly related to one or more of the Big Data characteristics of volume, velocity, or variety.
Note also that another outcome of this stage is the determination of the underlying budget required to carry out the analysis project. Any required purchase, such as tools, hardware and training, must be understood in advance so that the anticipated investment can be weighed against the expected benefits of achieving the goals. Initial iterations of the Big Data analytics lifecycle will require more up-front investment of Big Data technologies, products and training compared to later iterations where these earlier investments can be repeatedly leveraged.
Data Identification
The Data Identification stage shown in Figure 3.8 is dedicated to identifying the datasets required for the analysis project and their sources.
)
Figure 3.8 Data Identification is stage 2 of the Big Data analytics lifecycle.
Identifying a wider variety of data sources may increase the probability of finding hidden patterns and correlations. For example, to provide insight, it can be beneficial to identify as many types of related data sources as possible, especially when it is unclear exactly what to look for.
Depending on the business scope of the analysis project and nature of the business problems being addressed, the required datasets and their sources can be internal and/or external to the enterprise.
In the case of internal datasets, a list of available datasets from internal sources, such as data marts and operational systems, are typically compiled and matched against a pre-defined dataset specification.
In the case of external datasets, a list of possible third-party data providers, such as data markets and publicly available datasets, are compiled. Some forms of external data may be embedded within blogs or other types of content-based web sites, in which case they may need to be harvested via automated tools.
Data Acquisition and Filtering
During the Data Acquisition and Filtering stage, shown in Figure 3.9, the data is gathered from all of the data sources that were identified during the previous stage. The acquired data is then subjected to automated filtering for the removal of corrupt data or data that has been deemed to have no value to the analysis objectives.
)
Figure 3.9 Stage 3 of the Big Data analytics lifecycle.
Depending on the type of data source, data may come as a collection of files, such as data purchased from a third-party data provider, or may require API integration, such as with Twitter. In many cases, especially where external, unstructured data is concerned, some or most of the acquired data may be irrelevant (noise) and can be discarded as part of the filtering process.
Data classified as “corrupt” can include records with missing or nonsensical values or invalid data types. Data that is filtered out for one analysis may possibly be valuable for a different type of analysis. Therefore, it is advisable to store a verbatim copy of the original dataset before proceeding with the filtering. To minimize the required storage space, the verbatim copy can be compressed.
Both internal and external data needs to be persisted once it gets generated or enters the enterprise boundary. For batch analytics, this data is persisted to disk prior to analysis. In the case of realtime analytics, the data is analyzed first and then persisted to disk.
As evidenced in Figure 3.10, metadata can be added via automation to data from both internal and external data sources to improve the classification and querying. Examples of appended metadata include dataset size and structure, source information, date and time of creation or collection and language-specific information. It is vital that metadata be machine-readable and passed forward along subsequent analysis stages. This helps maintain data provenance throughout the Big Data analytics lifecycle, which helps to establish and preserve data accuracy and quality.
)
Figure 3.10 Metadata is added to data from internal and external sources.
Data Extraction
Some of the data identified as input for the analysis may arrive in a format incompatible with the Big Data solution. The need to address disparate types of data is more likely with data from external sources. The Data Extraction lifecycle stage, shown in Figure 3.11, is dedicated to extracting disparate data and transforming it into a format that the underlying Big Data solution can use for the purpose of the data analysis.
)
Figure 3.11 Stage 4 of the Big Data analytics lifecycle.
The extent of extraction and transformation required depends on the types of analytics and capabilities of the Big Data solution. For example, extracting the required fields from delimited textual data, such as with webserver log files, may not be necessary if the underlying Big Data solution can already directly process those files.
Similarly, extracting text for text analytics, which requires scans of whole documents, is simplified if the underlying Big Data solution can directly read the document in its native format.
Figure 3.12 illustrates the extraction of comments and a user ID embedded within an XML document without the need for further transformation.
)
Figure 3.12 Comments and user IDs are extracted from an XML document.
Figure 3.13 demonstrates the extraction of the latitude and longitude coordinates of a user from a single JSON field.
)
Figure 3.13 The user ID and coordinates of a user are extracted from a single JSON field.
Further transformation is needed in order to separate the data into two separate fields as required by the Big Data solution.
Data Validation and Cleansing
Invalid data can skew and falsify analysis results. Unlike traditional enterprise data, where the data structure is pre-defined and data is pre-validated, data input into Big Data analyses can be unstructured without any indication of validity. Its complexity can further make it difficult to arrive at a set of suitable validation constraints.
The Data Validation and Cleansing stage shown in Figure 3.14 is dedicated to establishing often complex validation rules and removing any known invalid data.
)
Figure 3.14 Stage 5 of the Big Data analytics lifecycle.
Big Data solutions often receive redundant data across different datasets. This redundancy can be exploited to explore interconnected datasets in order to assemble validation parameters and fill in missing valid data.
For example, as illustrated in Figure 3.15:
- The first value in Dataset B is validated against its corresponding value in Dataset A.
- The second value in Dataset B is not validated against its corresponding value in Dataset A.
- If a value is missing, it is inserted from Dataset A.
)
Figure 3.15 Data validation can be used to examine interconnected datasets in order to fill in missing valid data.
For batch analytics, data validation and cleansing can be achieved via an offline ETL operation. For realtime analytics, a more complex in-memory system is required to validate and cleanse the data as it arrives from the source. Provenance can play an important role in determining the accuracy and quality of questionable data. Data that appears to be invalid may still be valuable in that it may possess hidden patterns and trends, as shown in Figure 3.16.
)
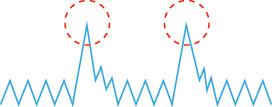
Figure 3.16 The presence of invalid data is resulting in spikes. Although the data appears abnormal, it may be indicative of a new pattern.
Data Aggregation and Representation
Data may be spread across multiple datasets, requiring that datasets be joined together via common fields, for example date or ID. In other cases, the same data fields may appear in multiple datasets, such as date of birth. Either way, a method of data reconciliation is required or the dataset representing the correct value needs to be determined.
The Data Aggregation and Representation stage, shown in Figure 3.17, is dedicated to integrating multiple datasets together to arrive at a unified view.
)
Figure 3.17 Stage 6 of the Big Data analytics lifecycle.
Performing this stage can become complicated because of differences in:
- Data Structure – Although the data format may be the same, the data model may be different.
- Semantics – A value that is labeled differently in two different datasets may mean the same thing, for example “surname” and “last name.”
The large volumes processed by Big Data solutions can make data aggregation a time and effort-intensive operation. Reconciling these differences can require complex logic that is executed automatically without the need for human intervention.
Future data analysis requirements need to be considered during this stage to help foster data reusability. Whether data aggregation is required or not, it is important to understand that the same data can be stored in many different forms. One form may be better suited for a particular type of analysis than another. For example, data stored as a BLOB would be of little use if the analysis requires access to individual data fields.
A data structure standardized by the Big Data solution can act as a common denominator that can be used for a range of analysis techniques and projects. This can require establishing a central, standard analysis repository, such as a NoSQL database, as shown in Figure 3.18.
)
Figure 3.18 A simple example of data aggregation where two datasets are aggregated together using the Id field.
Figure 3.19 shows the same piece of data stored in two different formats. Dataset A contains the desired piece of data, but it is part of a BLOB that is not readily accessible for querying. Dataset B contains the same piece of data organized in column-based storage, enabling each field to be queried individually.
)
Figure 3.19 Dataset A and B can be combined to create a standardized data structure with a Big Data solution.
Data Analysis
The Data Analysis stage shown in Figure 3.20 is dedicated to carrying out the actual analysis task, which typically involves one or more types of analytics. This stage can be iterative in nature, especially if the data analysis is exploratory, in which case analysis is repeated until the appropriate pattern or correlation is uncovered. The exploratory analysis approach will be explained shortly, along with confirmatory analysis.
)
Figure 3.20 Stage 7 of the Big Data analytics lifecycle.
Depending on the type of analytic result required, this stage can be as simple as querying a dataset to compute an aggregation for comparison. On the other hand, it can be as challenging as combining data mining and complex statistical analysis techniques to discover patterns and anomalies or to generate a statistical or mathematical model to depict relationships between variables.
Data analysis can be classified as confirmatory analysis or exploratory analysis, the latter of which is linked to data mining, as shown in Figure 3.21.
)
Figure 3.21 Data analysis can be carried out as confirmatory or exploratory analysis.
Confirmatory data analysis is a deductive approach where the cause of the phenomenon being investigated is proposed beforehand. The proposed cause or assumption is called a hypothesis. The data is then analyzed to prove or disprove the hypothesis and provide definitive answers to specific questions. Data sampling techiniques are typically used. Unexpected findings or anomalies are usually ignored since a predetermined cause was assumed.
Exploratory data analysis is an inductive approach that is closely associated with data mining. No hypothesis or predetermined assumptions are generated. Instead, the data is explored through analysis to develop an understanding of the cause of the phenomenon. Although it may not provide definitive answers, this method provides a general direction that can facilitate the discovery of patterns or anomalies.
Data Visualization
The ability to analyze massive amounts of data and find useful insights carries little value if the only ones that can interpret the results are the analysts.
The Data Visualization stage, shown in Figure 3.22, is dedicated to using data visualization techniques and tools to graphically communicate the analysis results for effective interpretation by business users.
)
Figure 3.22 Stage 8 of the Big Data analytics lifecycle.
Business users need to be able to understand the results in order to obtain value from the analysis and subsequently have the ability to provide feedback, as indicated by the dashed line leading from stage 8 back to stage 7.
The results of completing the Data Visualization stage provide users with the ability to perform visual analysis, allowing for the discovery of answers to questions that users have not yet even formulated. Visual analysis techniques are covered later in this book.
The same results may be presented in a number of different ways, which can influence the interpretation of the results. Consequently, it is important to use the most suitable visualization technique by keeping the business domain in context.
Another aspect to keep in mind is that providing a method of drilling down to comparatively simple statistics is crucial, in order for users to understand how the rolled up or aggregated results were generated.
Utilization of Analysis Results
Subsequent to analysis results being made available to business users to support business decision-making, such as via dashboards, there may be further opportunities to utilize the analysis results. The Utilization of Analysis Results stage, shown in Figure 3.23, is dedicated to determining how and where processed analysis data can be further leveraged.
)
Figure 3.23 Stage 9 of the Big Data analytics lifecycle.
Depending on the nature of the analysis problems being addressed, it is possible for the analysis results to produce “models” that encapsulate new insights and understandings about the nature of the patterns and relationships that exist within the data that was analyzed. A model may look like a mathematical equation or a set of rules. Models can be used to improve business process logic and application system logic, and they can form the basis of a new system or software program.
Common areas that are explored during this stage include the following:
- Input for Enterprise Systems – The data analysis results may be automatically or manually fed directly into enterprise systems to enhance and optimize their behaviors and performance. For example, an online store can be fed processed customer-related analysis results that may impact how it generates product recommendations. New models may be used to improve the programming logic within existing enterprise systems or may form the basis of new systems.
- Business Process Optimization – The identified patterns, correlations and anomalies discovered during the data analysis are used to refine business processes. An example is consolidating transportation routes as part of a supply chain process. Models may also lead to opportunities to improve business process logic.
- Alerts – Data analysis results can be used as input for existing alerts or may form the basis of new alerts. For example, alerts may be created to inform users via email or SMS text about an event that requires them to take corrective action.