- 13.1 Introduction
- 13.2 Experiments
- 13.3 Observation: An Example
- 13.4 Controlling to Block Non-causal Paths
- 13.5 Machine-Learning Estimators
- 13.6 Conclusion
This chapter is from the book
This chapter is from the book
This chapter is from the book
13.5 Machine-Learning Estimators
In general, you won’t want to estimate the full joint distribution under an intervention. You may not even be interested in marginals. Usually, you’re just interested in a difference in average effects.
In the simplest case, you’d like to estimate the expected difference in some outcome, Xj, per unit change in a variable you have control over, Xi. For example, you’d might like to measure E[Xj|do(Xi = 1)]− E[Xj|do(Xi = 0)]. This tells you the change in Xj you can expect on average when you set Xi to 1 from what it would be if Xi were set to 0.
Let’s revisit the g-formula to see how can measure these kinds of quantities.
13.5.1 The G-formula Revisited
The g-formula tells you how to estimate a causal effect, P(Xj|do(Xi = xi)), using observational data and a set of variables to control for (based on our knowledge of the causal structure). It says this:
)
If you take expectation values on each side (by multiplying by Xj and summing over Xj), then you find this:
)
In practice, it’s easy to estimate the first factor on the right side of this formula. If you fit a regression estimator using mean-squared error loss, then the best fit is just the expected value of Xj at each point (Xi, Z). As long as the model has enough freedom to accurately describe the expected value, you can estimate this first factor by using standard machine-learning approaches.
To estimate the whole left side, you need to deal with the P(Z) term, as well as the sum. It turns out there’s a simple trick for doing this. If your data was generated by drawing from the observational joint distribution, then your samples of Z are actually just draws from P(Z). Then, if you replace the P(Z) term by 1/N (for N samples) and sum over data points, you’re left with an estimator for this sum. That is, you can make the substitution as follows:
)
where the (k) index runs over our data points, from 1 to N. Let’s see how all of this works in an example.
13.5.2 An Example
Let’s go back to the graph in Figure 13.11. We’ll use an example from Judea Pearl’s book. We’re concerned with the sidewalk being slippery, so we’re investigating its causes. X5 can be 1 or 0, for slippery or not, respectively. You’ve found that the sidewalk is slippery when it’s wet, and you’ll use X4 to indicate whether the sidewalk is wet. Next, you need to know the causes of the sidewalk being wet. You see that a sprinkler is near the sidewalk, and if the sprinkler is on, it makes the sidewalk wet. X2 will indicate whether the sprinkler is on. You’ll notice the sidewalk is also wet after it rains, which you’ll indicate with X3 being 1 after rain, 0 otherwise. Finally, you note that on sunny days you turn the sprinkler on. You’ll indicate the weather with X1, where X1 is 1 if it is sunny, and 0 otherwise.
)
In this picture, rain and the sprinkler being on are negatively related to each other. This statistical dependence happens because of their mutual dependence on the weather. Let’s simulate some data to explore this system. You’ll use a lot of data, so the random error will be small, and you can focus your attention on the bias.
 1 import numpy as np
 2 import pandas as pd
 3 from scipy.special import expit
 4
 5 N = 100000
 6 inv_logit = expit
 7 x1 = np.random.binomial(1, p=0.5, size=N)
 8 x2 = np.random.binomial(1, p=inv_logit(-3.*x1))
 9 x3 = np.random.binomial(1, p=inv_logit(3.*x1))
10 x4 = np.bitwise_or(x2, x3)
11 x5 = np.random.binomial(1, p=inv_logit(3.*x4))
12
13 X = pd.DataFrame({'$x_1$': x1, '$x_2$': x2, '$x_3$': x3,
14                   '$x_4$': x4, '$x_5$': x5})
Every variable here is binary. You use a logistic link function to make logistic regression appropriate. When you don’t know the data-generating process, you might get a little more creative. You’ll come to this point in a moment!
Let’s look at the correlation matrix, shown in Figure 13.13. When the weather is good, the sprinkler is turned on. When it rains, the sprinkler is turned off. You can see there’s a negative relationship between the sprinkler being on and the rain due to this relationship.
)
Figure 13.13 The correlation matrix for the simulated data set. Notice that X2 and X3 are negatively related because of their common cause, X1.
There are a few ways you can get an estimate for the effect of X2 on X5. The first is simply by finding the probability that X5 = 1 given that X2 = 1 or X2 = 0. The difference in these probabilities tells you how much more likely it is that the sidewalk is slippery given that the sprinkler was on. A simple way to calculate these probabilities is simply to average the X5 variable in each subset of the data (where X2 = 0 and X2 = 1). You can run the following, which produces the table in Figure 13.14.
)
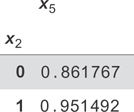
Figure 13.14 The naive conditional expectation values for whether the grass is wet given that the sprinkler is on, E[x5|x2 = x2]. This is not a causal result because you haven’t adjusted for confounders.
1 X.groupby('$x_2$').mean()[['$x_5$']]
If you look at the difference here, you see that the sidewalk is 0.95− 0.86 = 0.09, or nine percentage points more likely to be slippery given that the sprinkler was on. You can compare this with the interventional graph to get the true estimate for the change. You can generate this data using the process shown here:
 1 N = 100000
 2 inv_logit = expit
 3 x1 = np.random.binomial(1, p=0.5, size=N)
 4 x2 = np.random.binomial(1, p=0.5, size=N)
 5 x3 = np.random.binomial(1, p=inv_logit(3.*x1))
 6 x4 = np.bitwise_or(x2, x3)
 7 x5 = np.random.binomial(1, p=inv_logit(3.*x4))
 8
 9 X = pd.DataFrame({'$x_1$': x1, '$x_2$': x2, '$x_3$': x3,
10                   '$x_4$': x4, '$x_5$': x5})
Now, X2 is independent of X1 and X3. If you repeat the calculation from before (try it!), you get a difference of 0.12, or 12 percentage points. This is about 30 percent larger than the naive estimate!
Now, you’ll use some machine learning approaches to try to get a better estimate of the true (0.12) effect strictly using the observational data. First, you’ll try a logistic regression on the first data set. Let’s re-create the naive estimate, just to make sure it’s working properly.
 1 from sklearn.linear_model import LogisticRegression
 2
 3 # build our model, predicting $x_5$ using $x_2$
 4 model = LogisticRegression()
 5 model = model.fit(X[['$x_2$']], X['$x_5$'])
 6
 7
 8 # what would have happened if $x_2$ was always 0:
 9 X0 = X.copy()
10 X0['$x_2$'] = 0
11 y_pred_0 = model.predict_proba(X0[['$x_2$']])
12
13 # what would have happened if $x_2$ was always 1:
14 X1 = X.copy()
15 X1['$x_2$'] = 1
16 y_pred_1 = model.predict_proba(X1[['$x_2$']])
17
18 # now, let's check the difference in probabilities
19 y_pred_1[:, 1].mean() - y_pred_0[:,1].mean()
You first build a logistic regression model using X2 to predict X5. You do the prediction and use it to get probabilities of X5 under the X2 = 0 and X2 = 1 states. You did this over the whole data set. The reason for this is that you’ll often have more interesting data sets, with many more variables changing, and you’ll want to see the average effect of X2 on X5 over the whole data set. This procedure lets you do that. Finally, you find the average difference in probabilities between the two states, and you get the same 0.09 result as before!
Now, you’d like to do controlling on the same observational data to get the causal (0.12) result. You perform the same procedure as before, but this time you include X1 in the regression.
 1 model = LogisticRegression()
 2 model = model.fit(X[['$x_2$', '$x_1$']], X['$x_5$'])
 3
 4 # what would have happened if $x_2$ was always 0:
 5 X0 = X.copy()
 6 X0['$x_2$'] = 0
 7 y_pred_0 = model.predict_proba(X0[['$x_2$', '$x_1$']])
 8
 9 # what would have happened if $x_2$ was always 1:
10 X1 = X.copy()
11 X1['$x_2$'] = 1
12
13 # now, let's check the difference in probabilities
14 y_pred_1 = model.predict_proba(X1[['$x_2$', '$x_1$']])
15 y_pred_1[:, 1].mean() - y_pred_0[:,1].mean()
In this case, you find 0.14 for the result. You’ve over-estimated it! What went wrong? You didn’t actually do anything wrong with the modeling procedure. The problem is simply that logistic regression isn’t the right model for this situation. It’s the correct model for each variable’s parents to predict its value but doesn’t work properly for descendants that follow the parents. Can we do better, with a more general model?
This will be your first look at how powerful neural networks can be for general machine-learning tasks. You’ll learn about building them in a little more detail in the next chapter. For now, let’s try a deep feedforward neural network using keras. It’s called deep because there are more than just the input and output layers. It’s a feedforward network because you put some input data into the network and pass them forward through the layers to produce the output.
Deep feedforward networks have the property of being “universal function approximators,” in the sense that they can approximate any function, given enough neurons and layers (although it’s not always easy to learn, in practice). You’ll construct the network like this:
 1 from keras.layers import Dense, Input
 2 from keras.models import Model
 3
 4 dense_size = 128
 5 input_features = 2
 6
 7 x_in = Input(shape=(input_features,))
 8 h1 = Dense(dense_size, activation='relu')(x_in)
 9 h2 = Dense(dense_size, activation='relu')(h1)
10 h3 = Dense(dense_size, activation='relu')(h2)
11 y_out = Dense(1, activation='sigmoid')(h3)
12
13 model = Model(input=x_in, output=y_out)
14 model . compile(loss='binary_crossentropy', optimizer='adam')
15 model . fit(X[['$x_1$', '$x_2$']].values, X['$x_5$'])
Now do the same prediction procedure as before, which produces the result 0.129.
1 X_zero = X.copy()
2 X_zero['$x_2$'] = 0
3 x5_pred_0 = model.predict(X_zero[['$x_1$', '$x_2$']].values)
4
5 X_one = X.copy()
6 X_one['$x_2$'] = 1
7 x5_pred_1 = model.predict(X_one[['$x_1$', '$x_2$']].values)
8
9 x5_pred_1.mean() - x5_pred_0.mean()
You’ve done better than the logistic regression model! This was a tricky case. You’re given binary data where it’s easy to calculate probabilities, and you’d do the best by simply using the g-formula directly. When you do this (try it yourself!), you calculate the true result of 0.127 from this data. Your neural network model is very close!
Now, you’d like to enact a policy that would make the sidewalk less likely to be slippery. You know that if you turn the sprinkler on less often, that should do the trick. You see that enacting this policy (and so intervening to change the system), you can expect the slipperiness of the sidewalk to decrease. How much? You want to compare the pre-intervention chance of slipperiness with the post-intervention chance, when you set sprinkler = off. You can simply calculate this with our neural network model like so:
1 X['$x_5$'].mean() - x5_pred_0.mean()
This gives the result 0.07. It will be 7 percent less likely that the sidewalk is slippery if you make a policy of keeping the sprinkler turned off!