Why Tableau?
Tableau’s stated mission is to help analysts “see and understand” their data, focusing on enabling “powerful analytics for everyone.” To facilitate this, the company offers a suite of software products designed to meet the needs of a diverse group of users, from experienced analysts at enterprise-level organizations to academic users, data journalists, and other visual data storytellers who want to visualize data. All Tableau products excel at displaying data visually, using Tableau’s proprietary VizQL technology to enable an intuitive, drag-and-drop canvas on top of embedded and augmented analytics.
Our primary tool to apply the lessons learned in this book, Tableau Desktop can connect to a wide variety of data, stored in a variety of places on-premises or in the cloud—from SQL databases to local spreadsheets, and even many cloud database sources, such as those offered by Google Analytics, Amazon Redshift, and Salesforce. Although Tableau can mimic Excel by providing the capability to analyze rows and columns of numbers, its focus is on interactive, visual data exploration through its out-of-the-box analytic capabilities as well as dashboarding and storytelling features—no programming required. For more advanced users, Tableau offers augmented analytics powered by artificial intelligence (AI) and machine learning (ML) to streamline time to insight through statistics, natural language, and smart data prep, as well as predictive modeling and other data science techniques. Data scientists can integrate and visualize results from R, Python, Einstein Discovery, MATLAB, and other extensions to scale models. Content created in Tableau Desktop can be shared in a variety of methods, depending on the user’s specific needs.
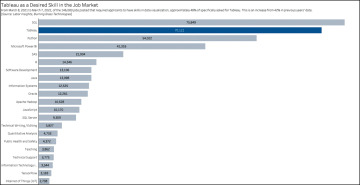
Founded in 2003 by an Academy Award–winning professor, a computer scientist from one of the world’s most prestigious universities, and a data-passionate business leader,3 Tableau has become synonymous with data visualization in today’s analytics space. In the years since its inception, it has moved beyond a tool to become a required specialized software skill—and one that is at the top of the list for many employers. As described in a 2019 paper published by IEEE Computer Graphics and Applications, my fellow researchers and I mined data from Labor Insight (Burning Glass), an analytics software company powered by the largest and most sophisticated database of labor market data, in an effort to analyze data visualization–related IT job descriptions posted between March 2017 and February 2018 across the United States. In the nearly 31,000 such jobs posted within that time frame, Tableau ranked as the second most in-demand specialized software skill for visual analysts (42% of such listings), outranked only by SQL.4 When the same study was repeated in 2022, in the data visualization–related IT job descriptions posted between March 2021 and March 2022, Tableau remained the second most in-demand specialized software skill (once again behind SQL), now being mentioned in 48% of those listings (Figure 3.2).

Figure 3.2 From March 8, 2021, to March 7, 2022, of the 146,083 jobs posted that required applicants to have skills in data visualization, approximately 48% of specifically asked for Tableau.
