- SQL Server Reference Guide
- Introduction
- SQL Server Reference Guide Overview
- Table of Contents
- Microsoft SQL Server Defined
- SQL Server Editions
- SQL Server Access
- Informit Articles and Sample Chapters
- Online Resources
- Microsoft SQL Server Features
- SQL Server Books Online
- Clustering Services
- Data Transformation Services (DTS) Overview
- Replication Services
- Database Mirroring
- Natural Language Processing (NLP)
- Analysis Services
- Microsot SQL Server Reporting Services
- XML Overview
- Notification Services for the DBA
- Full-Text Search
- SQL Server 2005 - Service Broker
- Using SQL Server as a Web Service
- SQL Server Encryption Options Overview
- SQL Server 2008 Overview
- SQL Server 2008 R2 Overview
- SQL Azure
- The Utility Control Point and Data Application Component, Part 1
- The Utility Control Point and Data Application Component, Part 2
- Microsoft SQL Server Administration
- The DBA Survival Guide: The 10 Minute SQL Server Overview
- Preparing (or Tuning) a Windows System for SQL Server, Part 1
- Preparing (or Tuning) a Windows System for SQL Server, Part 2
- Installing SQL Server
- Upgrading SQL Server
- SQL Server 2000 Management Tools
- SQL Server 2005 Management Tools
- SQL Server 2008 Management Tools
- SQL Azure Tools
- Automating Tasks with SQL Server Agent
- Run Operating System Commands in SQL Agent using PowerShell
- Automating Tasks Without SQL Server Agent
- Storage – SQL Server I/O
- Service Packs, Hotfixes and Cumulative Upgrades
- Tracking SQL Server Information with Error and Event Logs
- Change Management
- SQL Server Metadata, Part One
- SQL Server Meta-Data, Part Two
- Monitoring - SQL Server 2005 Dynamic Views and Functions
- Monitoring - Performance Monitor
- Unattended Performance Monitoring for SQL Server
- Monitoring - User-Defined Performance Counters
- Monitoring: SQL Server Activity Monitor
- SQL Server Instances
- DBCC Commands
- SQL Server and Mail
- Database Maintenance Checklist
- The Maintenance Wizard: SQL Server 2000 and Earlier
- The Maintenance Wizard: SQL Server 2005 (SP2) and Later
- The Web Assistant Wizard
- Creating Web Pages from SQL Server
- SQL Server Security
- Securing the SQL Server Platform, Part 1
- Securing the SQL Server Platform, Part 2
- SQL Server Security: Users and other Principals
- SQL Server Security – Roles
- SQL Server Security: Objects (Securables)
- Security: Using the Command Line
- SQL Server Security - Encrypting Connections
- SQL Server Security: Encrypting Data
- SQL Server Security Audit
- High Availability - SQL Server Clustering
- SQL Server Configuration, Part 1
- SQL Server Configuration, Part 2
- Database Configuration Options
- 32- vs 64-bit Computing for SQL Server
- SQL Server and Memory
- Performance Tuning: Introduction to Indexes
- Statistical Indexes
- Backup and Recovery
- Backup and Recovery Examples, Part One
- Backup and Recovery Examples, Part Two: Transferring Databases to Another System (Even Without Backups)
- SQL Profiler - Reverse Engineering An Application
- SQL Trace
- SQL Server Alerts
- Files and Filegroups
- Partitioning
- Full-Text Indexes
- Read-Only Data
- SQL Server Locks
- Monitoring Locking and Deadlocking
- Controlling Locks in SQL Server
- SQL Server Policy-Based Management, Part One
- SQL Server Policy-Based Management, Part Two
- SQL Server Policy-Based Management, Part Three
- Microsoft SQL Server Programming
- An Outline for Development
- Database
- Database Services
- Database Objects: Databases
- Database Objects: Tables
- Database Objects: Table Relationships
- Database Objects: Keys
- Database Objects: Constraints
- Database Objects: Data Types
- Database Objects: Views
- Database Objects: Stored Procedures
- Database Objects: Indexes
- Database Objects: User Defined Functions
- Database Objects: Triggers
- Database Design: Requirements, Entities, and Attributes
- Business Process Model Notation (BPMN) and the Data Professional
- Business Questions for Database Design, Part One
- Business Questions for Database Design, Part Two
- Database Design: Finalizing Requirements and Defining Relationships
- Database Design: Creating an Entity Relationship Diagram
- Database Design: The Logical ERD
- Database Design: Adjusting The Model
- Database Design: Normalizing the Model
- Creating The Physical Model
- Database Design: Changing Attributes to Columns
- Database Design: Creating The Physical Database
- Database Design Example: Curriculum Vitae
- NULLs
- The SQL Server Sample Databases
- The SQL Server Sample Databases: pubs
- The SQL Server Sample Databases: NorthWind
- The SQL Server Sample Databases: AdventureWorks
- The SQL Server Sample Databases: Adventureworks Derivatives
- UniversalDB: The Demo and Testing Database, Part 1
- UniversalDB: The Demo and Testing Database, Part 2
- UniversalDB: The Demo and Testing Database, Part 3
- UniversalDB: The Demo and Testing Database, Part 4
- Getting Started with Transact-SQL
- Transact-SQL: Data Definition Language (DDL) Basics
- Transact-SQL: Limiting Results
- Transact-SQL: More Operators
- Transact-SQL: Ordering and Aggregating Data
- Transact-SQL: Subqueries
- Transact-SQL: Joins
- Transact-SQL: Complex Joins - Building a View with Multiple JOINs
- Transact-SQL: Inserts, Updates, and Deletes
- An Introduction to the CLR in SQL Server 2005
- Design Elements Part 1: Programming Flow Overview, Code Format and Commenting your Code
- Design Elements Part 2: Controlling SQL's Scope
- Design Elements Part 3: Error Handling
- Design Elements Part 4: Variables
- Design Elements Part 5: Where Does The Code Live?
- Design Elements Part 6: Math Operators and Functions
- Design Elements Part 7: Statistical Functions
- Design Elements Part 8: Summarization Statistical Algorithms
- Design Elements Part 9:Representing Data with Statistical Algorithms
- Design Elements Part 10: Interpreting the Data—Regression
- Design Elements Part 11: String Manipulation
- Design Elements Part 12: Loops
- Design Elements Part 13: Recursion
- Design Elements Part 14: Arrays
- Design Elements Part 15: Event-Driven Programming Vs. Scheduled Processes
- Design Elements Part 16: Event-Driven Programming
- Design Elements Part 17: Program Flow
- Forming Queries Part 1: Design
- Forming Queries Part 2: Query Basics
- Forming Queries Part 3: Query Optimization
- Forming Queries Part 4: SET Options
- Forming Queries Part 5: Table Optimization Hints
- Using SQL Server Templates
- Transact-SQL Unit Testing
- Index Tuning Wizard
- Unicode and SQL Server
- SQL Server Development Tools
- The SQL Server Transact-SQL Debugger
- The Transact-SQL Debugger, Part 2
- Basic Troubleshooting for Transact-SQL Code
- An Introduction to Spatial Data in SQL Server 2008
- Performance Tuning
- Performance Tuning SQL Server: Tools and Processes
- Performance Tuning SQL Server: Tools Overview
- Creating a Performance Tuning Audit - Defining Components
- Creating a Performance Tuning Audit - Evaluation Part One
- Creating a Performance Tuning Audit - Evaluation Part Two
- Creating a Performance Tuning Audit - Interpretation
- Creating a Performance Tuning Audit - Developing an Action Plan
- Understanding SQL Server Query Plans
- Performance Tuning: Implementing Indexes
- Performance Monitoring Tools: Windows 2008 (and Higher) Server Utilities, Part 1
- Performance Monitoring Tools: Windows 2008 (and Higher) Server Utilities, Part 2
- Performance Monitoring Tools: Windows System Monitor
- Performance Monitoring Tools: Logging with System Monitor
- Performance Monitoring Tools: User Defined Counters
- General Transact-SQL (T-SQL) Performance Tuning, Part 1
- General Transact-SQL (T-SQL) Performance Tuning, Part 2
- General Transact-SQL (T-SQL) Performance Tuning, Part 3
- Performance Monitoring Tools: An Introduction to SQL Profiler
- Performance Tuning: Introduction to Indexes
- Performance Monitoring Tools: SQL Server 2000 Index Tuning Wizard
- Performance Monitoring Tools: SQL Server 2005 Database Tuning Advisor
- Performance Monitoring Tools: SQL Server Management Studio Reports
- Performance Monitoring Tools: SQL Server 2008 Activity Monitor
- The SQL Server 2008 Management Data Warehouse and Data Collector
- Performance Monitoring Tools: Evaluating Wait States with PowerShell and Excel
- Practical Applications
- Choosing the Back End
- The DBA's Toolbox, Part 1
- The DBA's Toolbox, Part 2
- Scripting Solutions for SQL Server
- Building a SQL Server Lab
- Using Graphics Files with SQL Server
- Enterprise Resource Planning
- Customer Relationship Management (CRM)
- Building a Reporting Data Server
- Building a Database Documenter, Part 1
- Building a Database Documenter, Part 2
- Data Management Objects
- Data Management Objects: The Server Object
- Data Management Objects: Server Object Methods
- Data Management Objects: Collections and the Database Object
- Data Management Objects: Database Information
- Data Management Objects: Database Control
- Data Management Objects: Database Maintenance
- Data Management Objects: Logging the Process
- Data Management Objects: Running SQL Statements
- Data Management Objects: Multiple Row Returns
- Data Management Objects: Other Database Objects
- Data Management Objects: Security
- Data Management Objects: Scripting
- Powershell and SQL Server - Overview
- PowerShell and SQL Server - Objects and Providers
- Powershell and SQL Server - A Script Framework
- Powershell and SQL Server - Logging the Process
- Powershell and SQL Server - Reading a Control File
- Powershell and SQL Server - SQL Server Access
- Powershell and SQL Server - Web Pages from a SQL Query
- Powershell and SQL Server - Scrubbing the Event Logs
- SQL Server 2008 PowerShell Provider
- SQL Server I/O: Importing and Exporting Data
- SQL Server I/O: XML in Database Terms
- SQL Server I/O: Creating XML Output
- SQL Server I/O: Reading XML Documents
- SQL Server I/O: Using XML Control Mechanisms
- SQL Server I/O: Creating Hierarchies
- SQL Server I/O: Using HTTP with SQL Server XML
- SQL Server I/O: Using HTTP with SQL Server XML Templates
- SQL Server I/O: Remote Queries
- SQL Server I/O: Working with Text Files
- Using Microsoft SQL Server on Handheld Devices
- Front-Ends 101: Microsoft Access
- Comparing Two SQL Server Databases
- English Query - Part 1
- English Query - Part 2
- English Query - Part 3
- English Query - Part 4
- English Query - Part 5
- RSS Feeds from SQL Server
- Using SQL Server Agent to Monitor Backups
- Reporting Services - Creating a Maintenance Report
- SQL Server Chargeback Strategies, Part 1
- SQL Server Chargeback Strategies, Part 2
- SQL Server Replication Example
- Creating a Master Agent and Alert Server
- The SQL Server Central Management System: Definition
- The SQL Server Central Management System: Base Tables
- The SQL Server Central Management System: Execution of Server Information (Part 1)
- The SQL Server Central Management System: Execution of Server Information (Part 2)
- The SQL Server Central Management System: Collecting Performance Metrics
- The SQL Server Central Management System: Centralizing Agent Jobs, Events and Scripts
- The SQL Server Central Management System: Reporting the Data and Project Summary
- Time Tracking for SQL Server Operations
- Migrating Departmental Data Stores to SQL Server
- Migrating Departmental Data Stores to SQL Server: Model the System
- Migrating Departmental Data Stores to SQL Server: Model the System, Continued
- Migrating Departmental Data Stores to SQL Server: Decide on the Destination
- Migrating Departmental Data Stores to SQL Server: Design the ETL
- Migrating Departmental Data Stores to SQL Server: Design the ETL, Continued
- Migrating Departmental Data Stores to SQL Server: Attach the Front End, Test, and Monitor
- Tracking SQL Server Timed Events, Part 1
- Tracking SQL Server Timed Events, Part 2
- Patterns and Practices for the Data Professional
- Managing Vendor Databases
- Consolidation Options
- Connecting to a SQL Azure Database from Microsoft Access
- SharePoint 2007 and SQL Server, Part One
- SharePoint 2007 and SQL Server, Part Two
- SharePoint 2007 and SQL Server, Part Three
- Querying Multiple Data Sources from a Single Location (Distributed Queries)
- Importing and Exporting Data for SQL Azure
- Working on Distributed Teams
- Professional Development
- Becoming a DBA
- Certification
- DBA Levels
- Becoming a Data Professional
- SQL Server Professional Development Plan, Part 1
- SQL Server Professional Development Plan, Part 2
- SQL Server Professional Development Plan, Part 3
- Evaluating Technical Options
- System Sizing
- Creating a Disaster Recovery Plan
- Anatomy of a Disaster (Response Plan)
- Database Troubleshooting
- Conducting an Effective Code Review
- Developing an Exit Strategy
- Data Retention Strategy
- Keeping Your DBA/Developer Job in Troubled Times
- The SQL Server Runbook
- Creating and Maintaining a SQL Server Configuration History, Part 1
- Creating and Maintaining a SQL Server Configuration History, Part 2
- Creating an Application Profile, Part 1
- Creating an Application Profile, Part 2
- How to Attend a Technical Conference
- Tips for Maximizing Your IT Budget This Year
- The Importance of Blue-Sky Planning
- Application Architecture Assessments
- Transact-SQL Code Reviews, Part One
- Transact-SQL Code Reviews, Part Two
- Cloud Computing (Distributed Computing) Paradigms
- NoSQL for the SQL Server Professional, Part One
- NoSQL for the SQL Server Professional, Part Two
- Object-Role Modeling (ORM) for the Database Professional
- Business Intelligence
- BI Explained
- Developing a Data Dictionary
- BI Security
- Gathering BI Requirements
- Source System Extracts and Transforms
- ETL Mechanisms
- Business Intelligence Landscapes
- Business Intelligence Layouts and the Build or Buy Decision
- A Single Version of the Truth
- The Operational Data Store (ODS)
- Data Marts – Combining and Transforming Data
- Designing Data Elements
- The Enterprise Data Warehouse — Aggregations and the Star Schema
- On-Line Analytical Processing (OLAP)
- Data Mining
- Key Performance Indicators
- BI Presentation - Client Tools
- BI Presentation - Portals
- Implementing ETL - Introduction to SQL Server 2005 Integration Services
- Building a Business Intelligence Solution, Part 1
- Building a Business Intelligence Solution, Part 2
- Building a Business Intelligence Solution, Part 3
- Tips and Troubleshooting
- SQL Server and Microsoft Excel Integration
- Tips for the SQL Server Tools: SQL Server 2000
- Tips for the SQL Server Tools – SQL Server 2005
- Transaction Log Troubles
- SQL Server Connection Problems
- Orphaned Database Users
- Additional Resources
- Tools and Downloads
- Utilities (Free)
- Tool Review (Free): DBDesignerFork
- Aqua Data Studio
- Microsoft SQL Server Best Practices Analyzer
- Utilities (Cost)
- Quest Software's TOAD for SQL Server
- Quest Software's Spotlight on SQL Server
- SQL Server on Microsoft's Virtual PC
- Red Gate SQL Bundle
- Microsoft's Visio for Database Folks
- Quest Capacity Manager
- SQL Server Help
- Visual Studio Team Edition for Database Professionals
- Microsoft Assessment and Planning Solution Accelerator
- Aggregating Server Data from the MAPS Tool
In a previous tutorial I introduced you to a tool that is included with every Windows Server operating system, the Windows System Monitor (also known as Performance Monitor). This tool gives you the ability to track and record changes on various objects on your Windows Workstation or Server. It's a tool used quite often the second phase of the performance tuning process, where you evaluate the system's components.
The previous introduction to the System Monitor focused on navigating and using the tool. This tutorial will show you how to create the output on a schedule, so in effect you can record historical metrics.
Before I get started, I'll revisit how the Windows System Monitor works. This tool uses three primary components to track things on your system.
The first component is System Monitor itself, which displays and controls the output of the things you're monitoring.
The second component is a set of registry entries. System Monitor creates some entries, and others are created by individual applications, such as SQL Server. These registry entries act as placeholders for the values a program can provide.
The last component is the application. Applications write the values into those registry entries that System Monitor created; based on the counters and objects they can track. For instance, SQL Server tracks an object Locks and one of the counters on the Lokcs Objects is is called Average Wait Time (ms). SQL Server writes the time (the value of the counter) of all lock waits into a registry location, and System Monitor reads and displays that value.
Using these three components is very efficient, since none of them will interfere with each other. Using registry entries as the intermediate mechanism is also why you'll see different counters on different systems, since the applications and even service packs change the entries that are there.
In this tutorial, I'll only show a few counters, but Books Online shows many more, based on the processes you are monitoring. What I'm interested in showing you here is the process to track counters, not the specific counters. The important thing is to understand what you're trying to monitor and keep that consistent throughout the monitoring that you do. In other tutorials I'll show you specific counters to track based on what you're trying to locate.
Another factor in choosing the objects and counters that you're after is the impact that the monitoring has on your system. Since the application is architected to create these counter values, there isn't a huge penalty for dealing with them, but the more you monitor, the more work the system has to do in writing and reading the values. For the most part, however, you won't have to be very concerned about the impact of the monitoring. In the example I'll show today, the performance hit the system will take is quite low.
The final factor in your monitoring decision is time. There are two parts to the time dimension of modeling: when you monitor, and the interval you use on the counters.
You should pick a time when there is low or little activity and continue the collection through the heavier periods of use. The monitoring should finish after another period of low activity. This creates a very good set of values to work with when you're using statistical methods of analysis or creating graphs from the data. If you're looking for peak activities, this is less important. It's also not always possible to find downtime, so you may be forced into monitoring only during peak use.
The second time dimension is the granularity of the values, or the interval. If you have a value that peaks every thirty seconds but you're monitoring by five-minute intervals, you'll miss a great deal of the values you're looking for. I have a set of systems at work that I monitor that house a large application, and my interval is five seconds for about 30 counters. I run that for 24 hours, and the log files I create are less than 10 megabytes in size. I pick up those logs and erase them from the server, and there is no noticeable impact to performance in the applications on that server. I do this about once a month.
Now that you understand the generalities of what you want to do, I'll explain how to set up a simple set of counters to be monitored. Before I do that, I'll explain what these counters are for.
My intent is to create a document that shows the pressure a system is under for a sizing exercise. I want to gather a historical set of values that will allow me to show minimum and maximum values, averages, and then standard deviations from those averages.
A standard deviation shows how far the values of a set of numbers are from the average. The closer to 0, the better the chances are that the numbers in the set are really close to the average. For instance, let's assume I have two coins in my pocket. The average value of those coins is 5.5 cents. But the standard deviation of those coins is 6.3 - meaning that I really can't trust that there are a lot of nickels in my pocket. I might actually have a dime and a penny.
The performance values I collect often work out the same way. Perhaps the processor shows that it is very busy for a short time, and then not busy at all. The average would tell me I'm fine at the current speed and number of processors — since it shows only 50% busy — but the standard deviation would show that the average are not be trustworthy. In that case I should pay attention to the distribution of the values through the set, since I want to ensure that the system is fast all of the time. I might have peaks of CPU use that cause the users to complain about the response of the system - if I only use the average of my counters I'll believe that the CPU is fine, when in fact the spikes are the issue.
With all that said, I'll get started. If you want to follow along, I'll show you how. Although the steps I'll use here shouldn't cause any problems on your system, you should always practice on a test server first, just in case. Once you're comfortable with the process, you can use it on your production systems. I'll start with the graphical method of creating a log, and then I'll explain a command-line tool you can use to automate the process.
There are two versions for the graphical tools, one found in earlier Windows Servers and the newer Reliability and Performance Monitor in Windows Server 2008 and higher. I'm focusing on the later versions, but the general concepts are the same.
First, log on to your test server and open the Start menu. In the Administrative Tools menu item you'll find the Reliability and Performance Monitor program. Start that, expand the Monitoring Tools object and then click the Performance Monitor icon and you're shown a screen that contains the Performance Monitor.
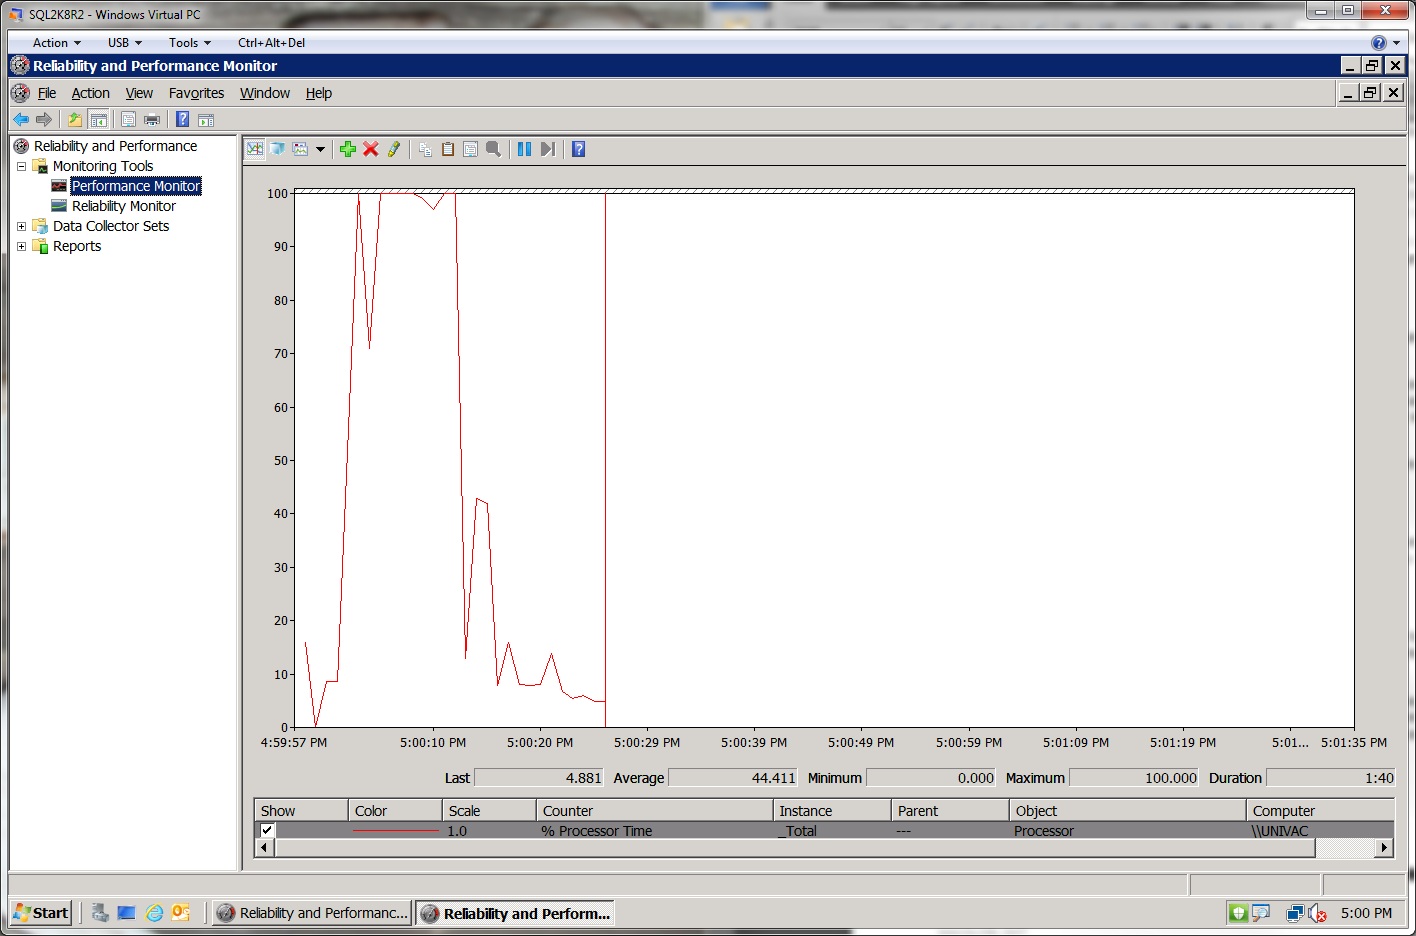
The first step in using this graphical tool is to create the objects and counters that you want to track. the Processor object and the % Processor Time counter is already selected, with the _Total set of instances. That means the graph you see is showing the value of the percentage of time the processors (all of them, added as a group because of the _Total setting) is using on the system. It's a general indication of how busy your system is - at least from the processor perspective. You can leave that one running for now, but you want to add a few more.
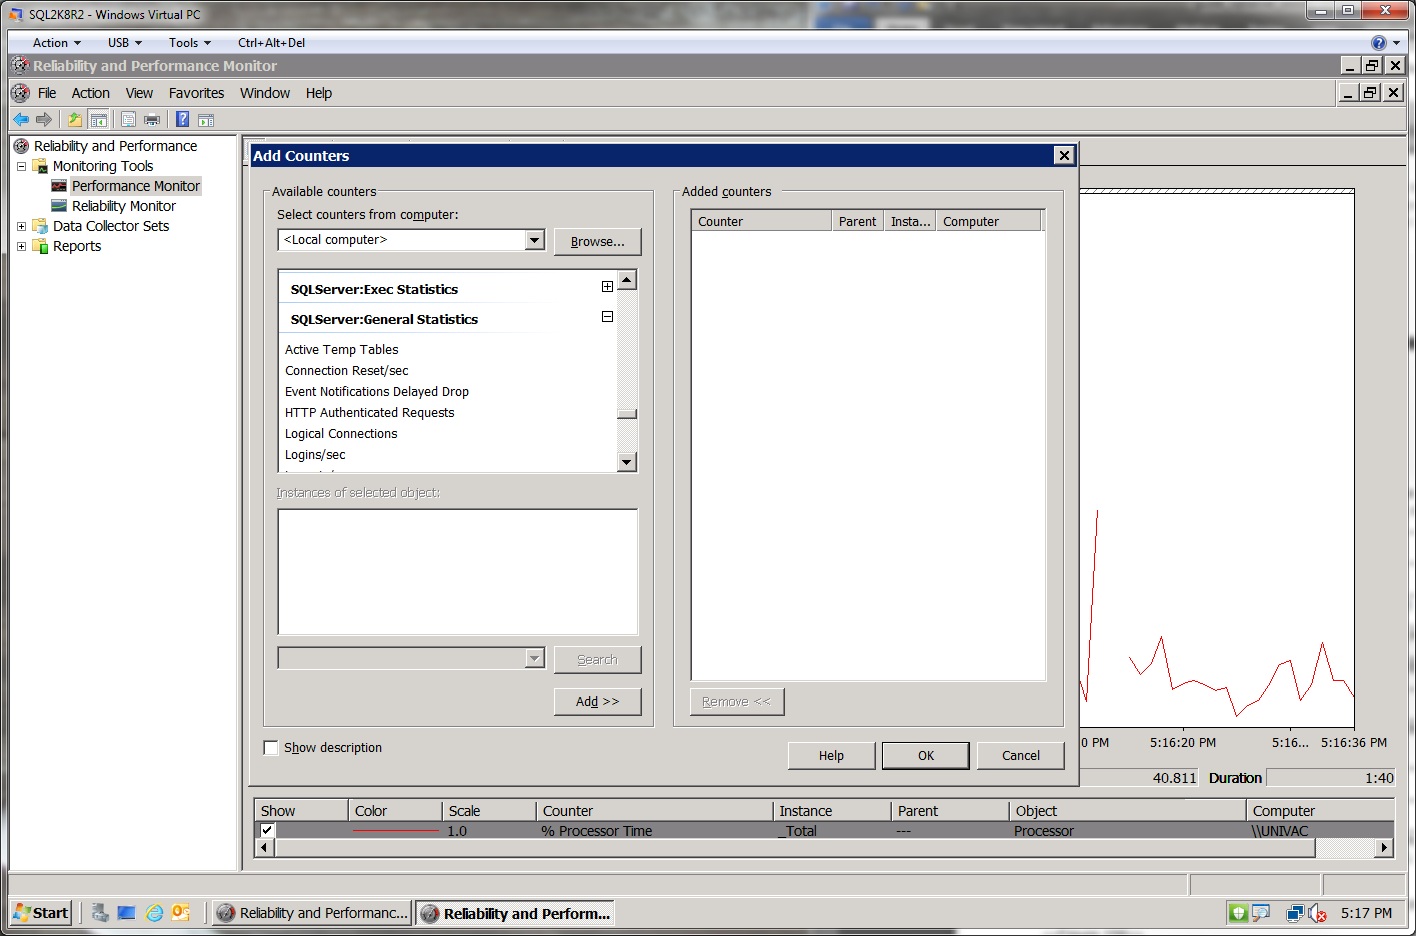
To do that, click the green plus-sign ( + ) icon in the top bar of the right-hand pane. That brings up a view similar to this one.
You'll see a list of objects on your system, such as the SQL Server: Memory Manager I've got here. If you click the Plus-sign next to that object the counters it contains show below it.
At first, all of the counters are selected, until you make a choice. Select the objects you wish, and click the Add >> button to add them to the collection on your screen. Then scroll to other objects and expand those to add more.
Here are a few objects that I am collecting on this test system - add them to yours if you wish.
Object |
Counter |
Processor |
Processor Time (_Total) |
SQL Server:Memory Manager |
Target Server Memory (KB) |
SQL Server:Memory Manager |
Total Server Memory (KB) |
Logical Disk |
Avg. Disk sec/Transfer |
Network Interface |
Bytes Total/sec (select the network card the users are on) |
SQL Server: General Statistics |
Transactions |
SQL Server: General Statistics |
User Connections |
With those added, you can see them working the counters across the screen. You can leave the default interval for now (a counter every 1 second) but in production you normally want to set this to a higher value, such as 5 seconds or even higher. The more often you collect these metrics, the larger the logging file and the more impact you'll have on your system.
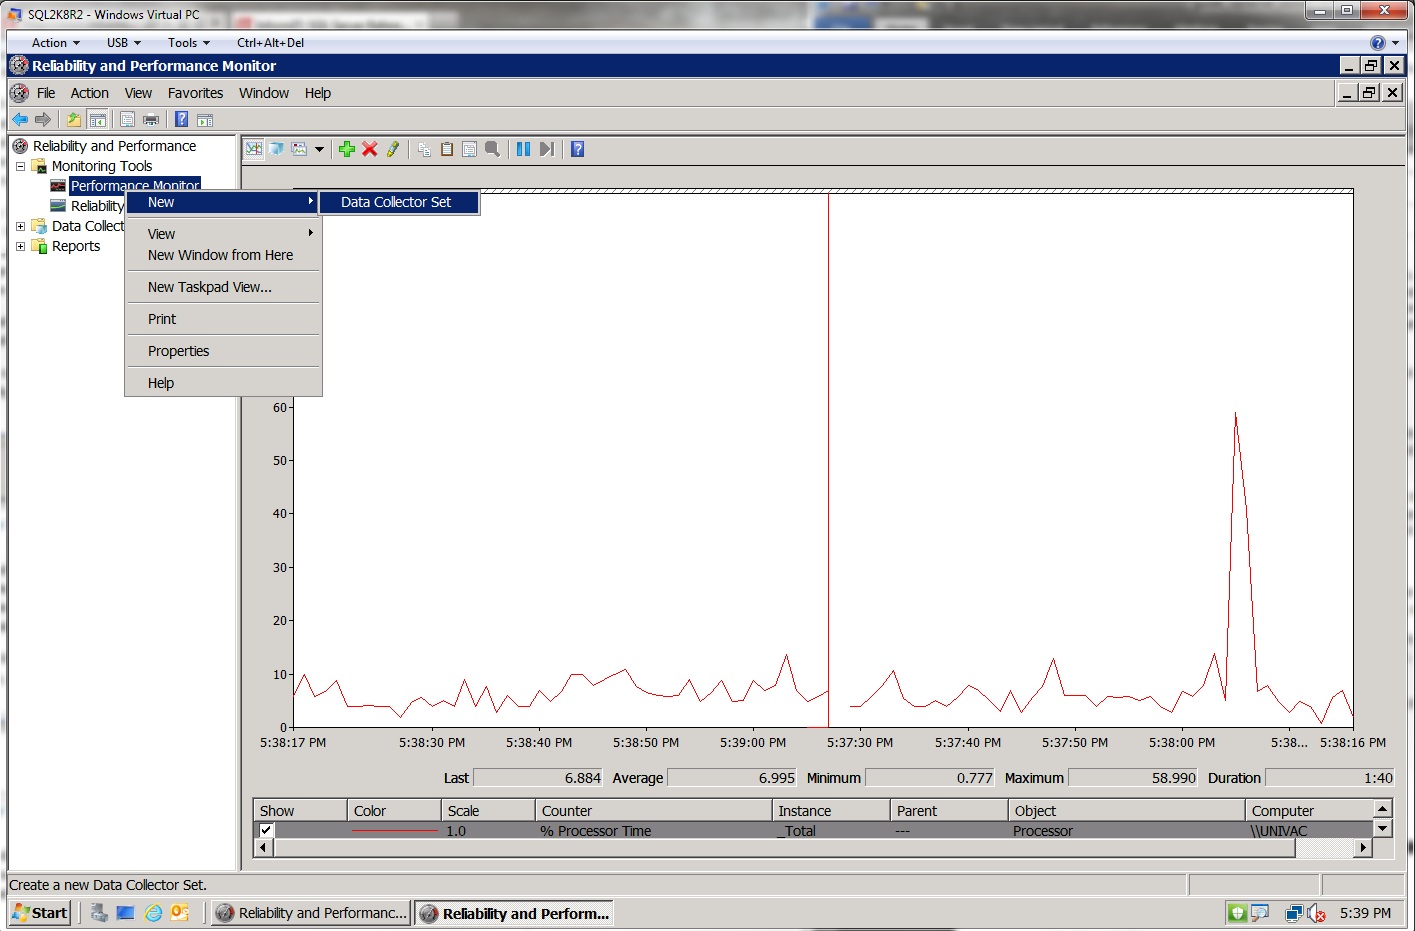
With the counters added, it's now time to make them into a logging file. Right-click the Performance Monitor icon and select New and then Data Collector Set. That brings up a panel where you can create the settings for the log file - the objects and counters you want to track. They will pick up from the screen selections you just made.
You're first asked to name the collector set - I called mine "SQLServer," with no spaces. That will make it a bit easier for the automation I'll create later. You can call yours anything you like. With that selection made, you can click the Next button.
Next you're asked where to save the collection set. I'm putting mine in the TEMP directory on my C drive, but once again you can place yours wherever you like - just remember to note down the location. Now click Finish.
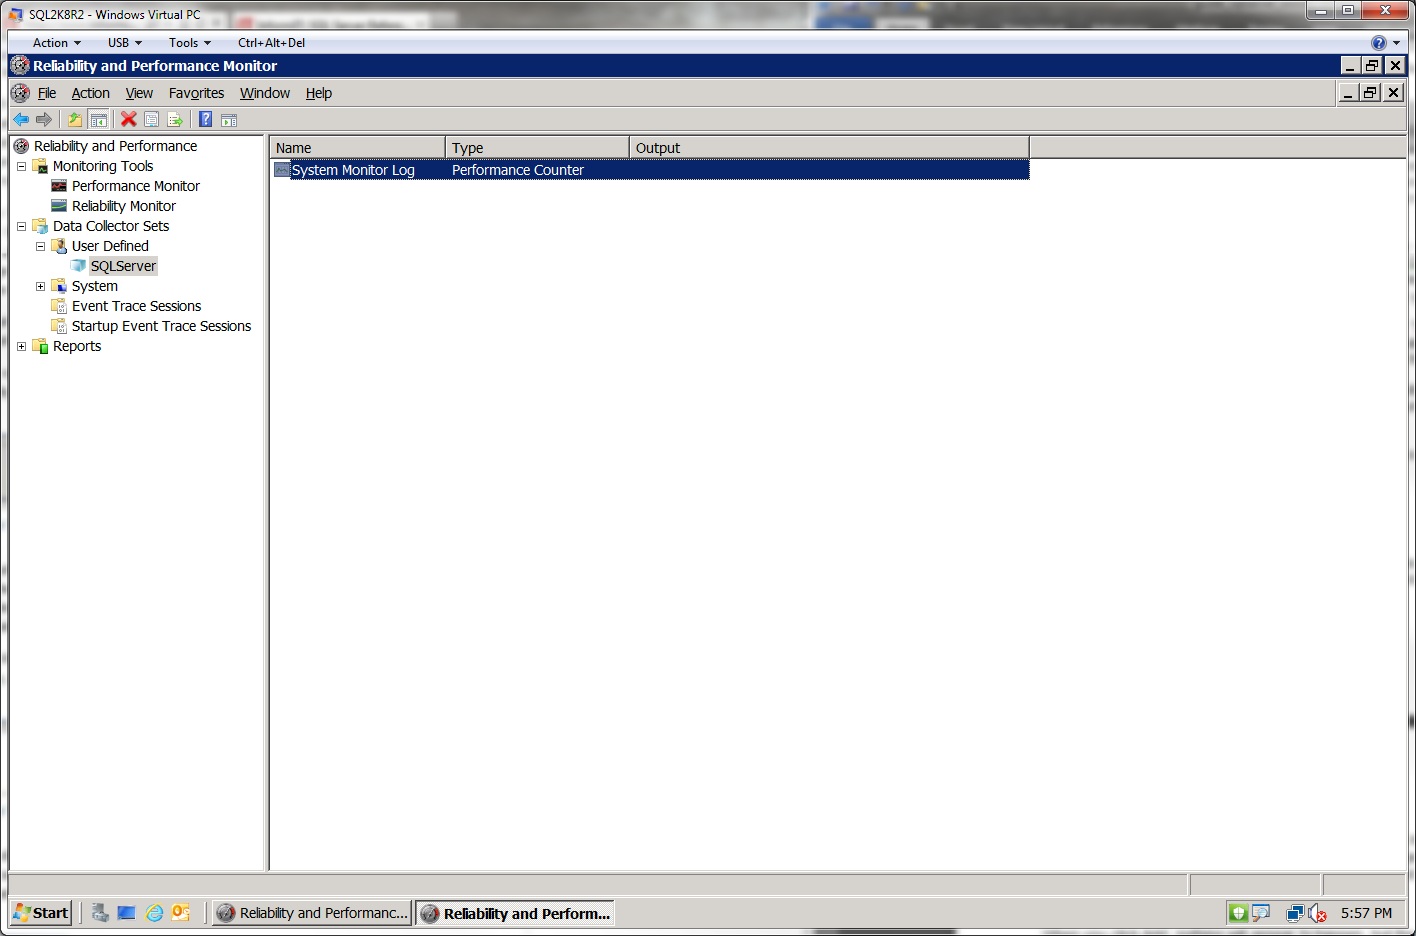
Your counters will continue to display - but you now have a new object on your system. To display it, and control it, expand the Data Collector Sets icon in the left-hand pane. Expand the User Defined object there and you should see the name you typed in a moment ago.
You can double-click this name if you wish, and from there you can edit the objects and counters it contains. Do that now, and change the format of the file to Comma Separated Values (CSV) from the main panel there. This ensures you can open it in a spreadsheet later - or even import the data into SQL Server if you wish.
You can also click the green arrow icon in the top bar to start the collection of that data into the file you specified - but don't do that just yet. While that will collect the data, odds are you won't want to do this by hand each time you want to collect data. It's far better to make a batch file with the commands I'll show you later. In fact, you can just use the commands in the Windows Task Scheduler or even as a PowerShell line in the SQL Server Agent to schedule the collections to perform baselines or in response to an event that you want to know more about.
Now that you have the Data Collector set, open a command prompt, and optionally navigate to where you saved it. In my case, as you recall, it was on the C:\Temp directory.
From there, simply type the commands you see below, substituting the name you gave your Data Collector Set for mine:
LOGMAN "SQLServer" Start
Wait a period of time - in my case I waited just a few minutes - and then type (or run from an automation tool as I described) the command:
LOGMAN "SQLServer" Stop
If you list the contents of that directory you'll see the CSV file you made of the counters. From there it's a simple matter of importing the CSV file into your spreadsheet, or even use the BULK IMPORT command in Transact-SQL or even SQL Server Integration Services (SSIS) to import the file into a table.
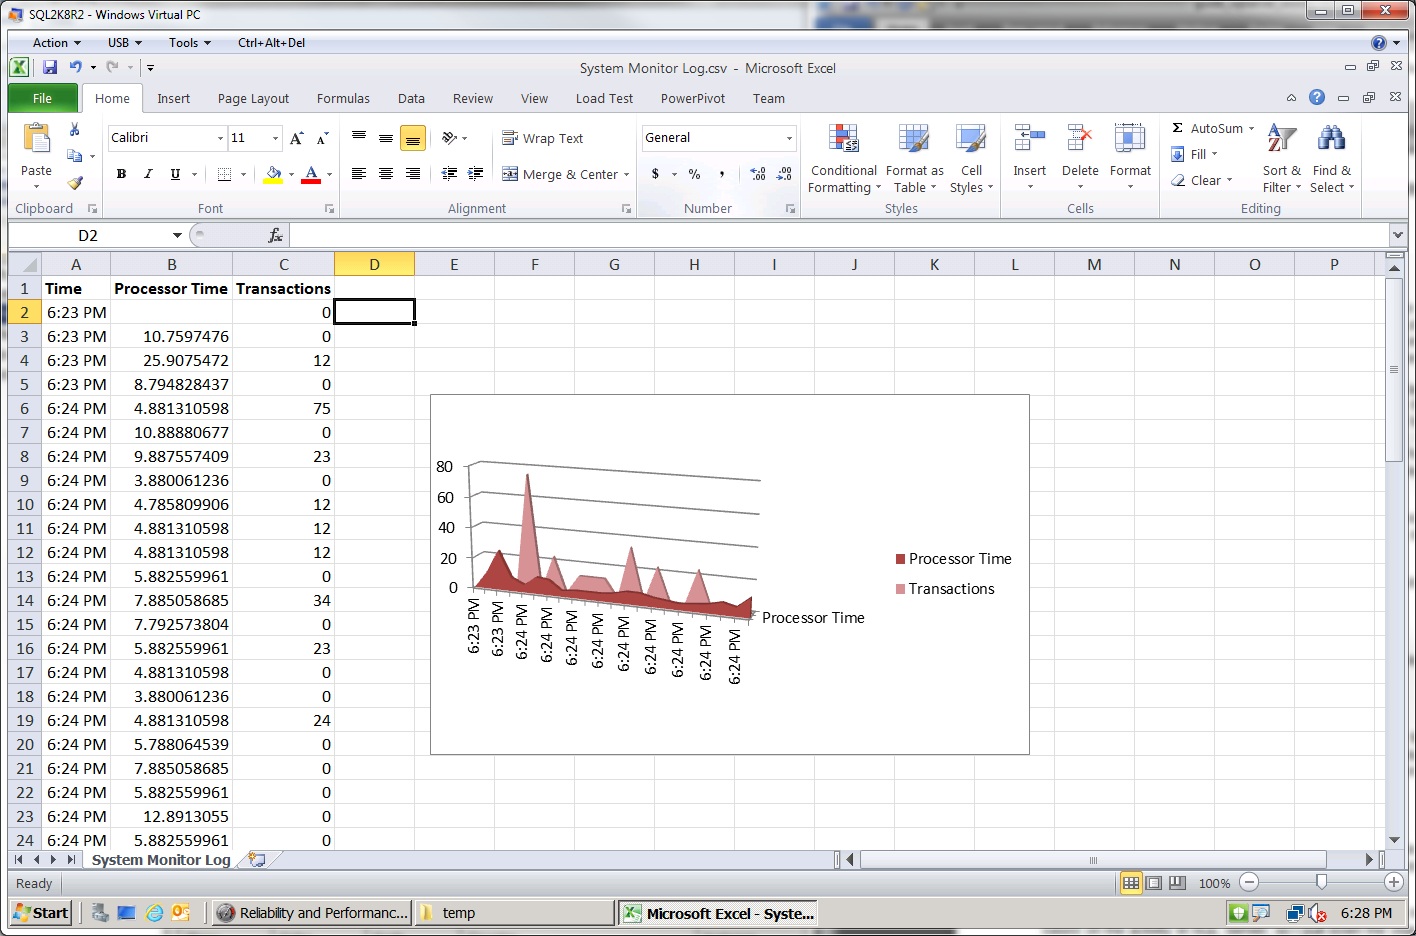
I use Microsoft Office Excel quite often, so I'll import mine into that. I open the directory in Windows, then right-click the file and open it in Excel. I changed the format of the first column to time, and the headings of the second and third columns to something more easy to read - on my system I just collected two counters for this display. Then I made a graph of the results.
In PowerShell, you can even automate the creation of the spreadsheet, create a web page instead, send the data in an e-mail, or even perform calculations on the data if you wish. The possibilities are wide open.
I automate this type of collection at least once a month, and then do comparisons from month to month to be able to predict when I need to add hardware, more aggressively tune systems, or even when I should roll one system over to another. I also use it to see which systems can be consolidated or virtualized.
