
- Random Numbers and Probability Distributions
- Casino Royale: Roll the Dice
- Normal Distribution
- The Student Who Taught Everyone Else
- Statistical Distributions in Action
- Hypothetically Yours
- The Mean and Kind Differences
- Worked-Out Examples of Hypothesis Testing
- Exercises for Comparison of Means
- Regression for Hypothesis Testing
- Analysis of Variance
- Significantly Correlated
- Summary
This chapter is from the book
This chapter is from the book
This chapter is from the book
Statistical Distributions in Action
I now illustrate some applied concepts related to the Normal distribution. Assuming that the data are “normally” distributed, I can in fact determine the likelihood of an event. For instance, consider the Teaching Ratings data, which I have discussed in detail in Chapters 4 and 5. The data set contains details on course evaluations for 463 courses and the attributes of the instructors. Professor Hamermesh and his co-author wanted to determine whether the subjective measure of an instructor’s appearance influenced his or her teaching evaluation score.
The descriptive statistics for some variables in the data set are presented in Table 6.2. I also report the R code in this chapter used to generate the output. The following code launches two R packages: xtable and psych. It commits the data file to R’s dedicated reference memory and then runs summary statistics, which are formatted and produced using the RMarkdown extensions.
### download data from the course's website
library(xtable)
library(psych)
attach(TeachingRatings)
tab <- xtable(describe(cbind(eval, age, beauty, students, allstudents),
                       skew=F, ranges=F), digits=3)
rownames(tab)<- c("teaching evaluation score", "instructor's age",
             "beauty score", "students responding to survey","students
             registered in course")
print(tab, type="html")
Table 6.2 Summary Statistics for Teaching Evaluation Data
vars |
n |
mean |
sd |
se |
|
teaching evaluation score |
1 |
463 |
3.998 |
0.554 |
0.026 |
instructor’s age |
2 |
463 |
48.365 |
9.803 |
0.456 |
beauty score |
3 |
463 |
0.000 |
0.789 |
0.037 |
students responding to survey |
4 |
463 |
36.624 |
45.018 |
2.092 |
students registered in course |
5 |
463 |
55.177 |
75.073 |
3.489 |
Table 6.2 demonstrates that the average course evaluation (non-weighted mean) was 3.998 and the standard deviation (SD) was 0.554. I also report descriptive statistics for other variables in the table and plot the histogram for the teaching evaluation score to visualize the distribution (see Figure 6.8). I see that the teaching evaluation scores peak around 4.0 with a relatively larger spread on the right, suggesting more frequent occurrence of higher than average teaching evaluation scores than lower teaching evaluation scores.
histogram(TeachingRatings$eval, nint=15, aspect=2,
          xlab="teaching evaluation score", col=c("dark grey"))
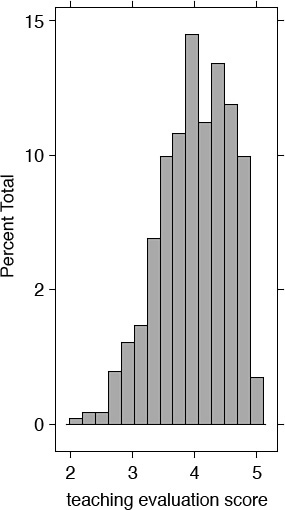
Figure 6.8 Histogram of teaching evaluation scores
I can plot a Normal density function based on descriptive statistics for the evaluation data. If I were to assume that the teaching evaluation scores were normally distributed, I only need the mean and standard deviation to plot the Normal density curve. The resulting plot is presented in Figure 6.9.
)
Figure 6.9 Normal distribution curve with mean=3.998, and sd=0.554
Unlike the histogram presented in Figure 6.8, the theoretical distribution in Figure 6.9 is more symmetrical, suggesting that the theoretical distributions are neater and symmetrical, whereas the real-world data is “messier.”
Z-Transformation
A related and important concept is the z-transformation of a variable. One can transform a variable such that its transformed version returns a mean of 0 and a standard deviation of 1. I use the formula in Equation 6.3 for z-transformation:
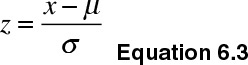
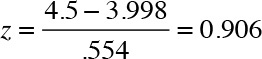
The preceding equation showcases x as the raw data, μ as the mean and σ as the standard deviation. For example, if an instructor received a course evaluation of 4.5, the z-transformation can be calculated as follows:
I can create a new variable by standardizing the variable eval and plot a histogram of the standardized variable. The mean of the standardized variable is almost 0 and the standard deviation equals 1 (see Figure 6.10).
z.eval<-as.matrix((TeachingRatings$eval-3.998)/.554)
histogram(z.eval, nint=15, aspect=2,
   xlab=" normalized teaching evaluation score", col=c("dark grey"))
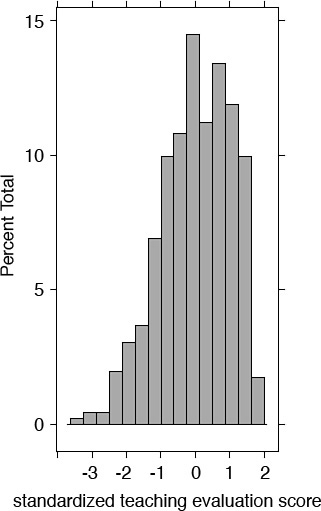
Figure 6.10 Histogram of standardized teaching evaluation score
The z-transformed data is useful in determining the probability of an event being larger or smaller than a certain threshold. For instance, assuming that the teaching evaluations are normally distributed, I can determine the probability of an instructor receiving a teaching evaluation greater or lower than a particular value. I explain this concept in the following section.
Probability of Getting a High or Low Course Evaluation
Let us assume that the variable eval is Normally distributed. I can determine the probability of obtaining the evaluation higher or lower than a certain threshold. For instance, let us determine the probability of an instructor receiving a course evaluation of higher than 4.5 when the mean evaluation is 3.998 and the standard deviation (SD) is 0.554. All statistical software, including spreadsheets such as Microsoft Excel, provide built-in formulae to compute these probabilities. See the following R code.
pnorm(c(4.5), mean=3.998, sd=0.554, lower.tail=FALSE)
R readily computes 0.1824, or simply 18.24%. This suggests that the probability of obtaining a course evaluation of higher than 4.5 is 18.24%.
Another way of conceptualizing the probability of obtaining a teaching evaluation of higher than 4.5 is to see it illustrated in a plot (see Figure 6.11). Notice that the area under the curve to the right of the value 4.5 is shaded gray, which represents the probability of receiving a teaching evaluation score of higher than 4.5.
)
Figure 6.11 Probability of obtaining a teaching evaluation score of greater than 4.5
The gray-shaded part of the area represents 18.24% of the area under the curve. The area under the normal distribution curve is assumed as one, or in percentage terms, 100%. This is analogous to a histogram and represents the collective probability of all possible values attained by a variable. Thus, the probability of obtaining a course evaluation of greater than or equal to 4.5 (the area shaded in gray) is 0.1824. The probability of obtaining a teaching evaluation of less than or equal to 4.5 will be 1 – 0.1824 = 0.8176 or 81.76%, which is shaded gray in Figure 6.12.
)
Figure 6.12 Probability of obtaining a teaching evaluation score of less than 4.5
Probabilities with Standard Normal Table
Now let us repeat the same calculations using a calculator and the probability tables. I first standardize the raw data to determine the probability of a teaching evaluation score of higher than 4.5. I have demonstrated earlier the calculations to standardize 4.5, which equals 0.906.
The next step is to determine the probability value (p-value) from the probability table in Figure 6.13. Notice that the p-values listed in the table are for probability of less than or equal to a certain value, which is referred to as the left tail of the distribution. I need to subtract the p-value from 1 to obtain the probability value for greater than the selected value. The table expresses z-scores up to two decimal points.
)
)
)
From the calculations, you see that z approximates to 0.91, for a teaching evaluation score of 4.5. I search for the p-value corresponding to Z = 0.91 in Figure 6.13. I locate 0.9 in the first column and then locate 0.01 in the first row. The p-value reported in the cell at the intersection of the aforementioned row and column is 0.8186 or 81.86% (also highlighted in the table with a box). Notice that this is the probability of getting a course evaluation of 4.5 or less. Notice also that this value is almost the same as reported in the value listed in the figure generated by R. Slight differences are due to rounding.
To obtain the probability of receiving a course evaluation of higher than 4.5, I simply subtract 0.8186 from 1; I have 1 – 0.8186 = 0.1814 or 18.14%.
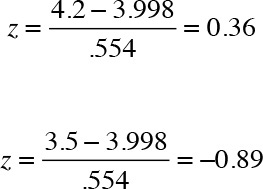
Let us now try to determine the probability of receiving a course evaluation between 3.5 and 4.2. I first need to standardize both scores. Here are the calculations.
Remember that:
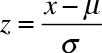
Thus,
From the Standard Normal Table you need to search for two values: one for Z = 0.36 and the other for Z = –0.89. The difference between the corresponding p-values will give the probability for course evaluations falling between 3.5 and 4.2. The calculations are straightforward for 4.2. The standardized value (z-score) is 0.36, which is highlighted in the table where the corresponding row and column intersect to return a p-value of 0.64 or 64%. This implies that the probability of receiving a course evaluation of 4.2 or less is 64%.
The z-transformation for 3.5 returns a negative z-score of –0.899. I again use Figure 6.13 to first locate 0.8 in the first column and then 0.09 in the first row and search for the corresponding p-value that is located at the intersection of the two. The resulting value is 0.8133. However, this is the p-value that corresponds to a z-score of +0.899. The p-value corresponding to a z-score of –0.899 is 1–p-value, which happens to be 1–0.8133 = 0.18 or 18%, which suggests that the probability of obtaining a course evaluation of 3.5 or less is 18%. The results are presented in Table 6.3.
Table 6.3 Standardizing Teaching Evaluation Scores
Raw Data |
Z-transformed |
P-value ≤ Z |
4.2 |
0.362 |
0.64 or 64% |
3.5 |
-0.899 |
1-0.8133 = 0.186 or 18.6% |
I still have not found the answer to the question regarding the probability of obtaining a course evaluation of greater than 3.5 and less than or equal to 4.2. To illustrate the concept consider Figure 6.14. The shaded area represents the probability of obtaining a teaching evaluation between 3.5 and 4.2. From Table 6.3, I see that the probability of a teaching evaluation of 4.2 or less is 0.64 and for a teaching evaluation of 3.5 or lower is 0.186, so the difference between the two will have our answer.
)
Figure 6.14 Probability of obtaining teaching evaluation score of greater than 3.5 and 4.2 or less
Mathematically:
- 0.64 – 0.18 = 0.46
Thus, 46% is the probability of obtaining a course evaluation of greater than 3.5 and 4.2 or lower. It is marked by the unshaded area in Figure 6.14.
The probability can be readily obtained in statistical software, such as R and Stata.
R code:
1-(pnorm(c(4.2, 3.5), mean = 3.998, sd = .554, lower.tail=F))
or
pnorm(.362)-pnorm(-.899)
Stata code:
di 1-(1-normal(.362) + normal(-.899))