- 1.1 Introduction
- 1.2 The Molecular Nature of Energy, Temperature, and Pressure
- 1.3 The Molecular Nature of Entropy
- 1.4 Basic Concepts
- 1.5 Real Fluids and Tabulated Properties
- 1.6 Summary
- 1.7 Practice Problems
- 1.8 Homework Problems
This chapter is from the book
This chapter is from the book
This chapter is from the book
1.5 Real Fluids and Tabulated Properties
The thermodynamic behavior of real fluids differs from the behavior of ideal gases in most cases. Real fluids condense, evaporate, freeze, and melt. Characterization of the volume changes and energy changes of these processes is an important skill for the chemical engineer. Many real fluids do behave as if they are ideal gases at typical process conditions. P-V behavior of a very common real fluid (i.e., water) and an ideal gas can be compared in Figs. 1.3 and 1.4. Application of the ideal gas law simplifies many process calculations for common gases; for example, air at room temperature and pressures below 10 bars. However, you must always remember that the ideal gas law is an approximation (sometimes an excellent approximation) that must be applied carefully to any fluid. The behaviors are presented along isotherms (lines of constant temperature) and the deviations from the ideal gas law for water are obvious. Water is one of the most common substances that we work with, and water vapor behaves nearly as an ideal gas at 100°C (Psat = 0.1014 MPa), where experimentally the vapor volume is 1.6718 m3/kg (30,092 cm3/mol) and by the ideal gas law we may calculate V = RT/P = 8.314 · 373.15 / 0.1014 = 30,595 cm3/mol. However, the state is the normal boiling point, and we are well aware that a liquid phase can co-exist at this state. This is because there is another density of water at these conditions that is also stable.11
)
)
 A 3D steam diagram is available as a MATLAB file called PVT.m. The diagram can be rotated to view the 2-D projections.
)
Figure 1.4 P-V-T behavior of water at the same temperatures used in . The plot is prepared from the steam tables in Appendix E.
We will frequently find it convenient to work mathematically in terms of molar density or mass density, which is inversely related to molar volume or mass volume, ρ = 1/V. Plotting the isotherms in terms of density yields a P-Δ diagram that qualitatively looks like the mirror image of the P-V diagram. Density is convenient to use because it always stays finite as P 0, whereas V diverges. Examples of P-ρ diagrams are shown in Fig. 7.1 on page 254.
Real fluids have saturation conditions, bubble points, and dew points.
The conditions where two phases coexist are called saturation conditions. The terms "saturation pressure" and "saturation temperature" are used to refer to the state. The volume (or density) is called the saturated volume (or saturated density). Saturation conditions are shown in Fig. 1.4 as the "hump" on the diagram. The hump is called the phase envelope. Two phases coexist when the system conditions result in a state inside or on the envelope. The horizontal lines inside the curves are called tie lines that show the two volumes (saturated liquid and saturated vapor) that can coexist. The curve labeled "Sat'd Liquid" is also called the bubble line, since it represents conditions where boiling (bubbles) can occur in the liquid. The curve labeled "Sat'd Vapor" is also called a dew line, since it is the condition where droplets (dew) can occur in the vapor. Therefore, saturation is a term that can refer to either bubble or dew conditions. When the total volume of a system results in a system state on the saturated vapor line, only an infinitesimal quantity of liquid exists, and the state is indicated by the term "saturated vapor." Likewise, when a system state is on the saturated liquid line, only an infinitesimal quantity of vapor exists, and the state is indicated by the term "saturated liquid." When the total volume of the system results in a system in between the saturation vapor and saturation liquid volumes, the system will have vapor and liquid phases coexisting, each phase occupying a finite fraction of the overall system. Note that each isotherm has a unique saturation pressure. This pressure is known as the saturation pressure or vapor pressure. Although the vapor pressure is often used to characterize a pure liquid's bubble point, recognize that it also represents the dew point for the pure vapor.
Following an isotherm from the right side of the diagram along a path of decreasing volume, the isotherm starts in the vapor region, and the pressure rises as the vapor is isothermally compressed. As the volume reaches the saturation curve at the vapor pressure, a liquid phase begins to form. Notice that further volume decreases do not result in a pressure change until the system reaches the saturated liquid volume, after which further decreases in volume require extremely large pressure changes. Therefore, liquids are often treated as incompressible even though the isotherms really do have a finite rather than infinite slope. The accuracy of the incompressible assumption varies with the particular application.
Liquids are quite incompressible.
As we work problems involving processes, we need to use properties such as the internal energy of a fluid.12 Properties such as these are available for many common fluids in terms of a table or chart. For steam, both tables and charts are commonly used, and in this section we introduce the steam tables available in Appendix E. An online supplement is available to visualize the P-V and P-T representations in MATLAB permitting the user to interactively rotate the surface.
Steam Tables
When dealing with water, some conventions have developed for referring to the states which can be confusing if the terms are not clearly understood. Steam refers to a vapor state, and saturated steam is vapor at the dew point. For water, in the two-phase region, the term "wet steam" is used to indicate a vapor + liquid system.
Steam properties are divided into four tables. The first table presents saturation conditions indexed by temperature. This table is most convenient to use when the temperature is known. Each row lists the corresponding saturation values for pressure (vapor pressure), internal energy, volume, and two other properties we will use later in the text: enthalpy and entropy. Special columns represent the internal energy, enthalpy, and entropy of vaporization. These properties are tabulated for convenience, although they can be easily calculated by the difference between the saturated vapor value and the saturated liquid value. Notice that the vaporization values decrease as the saturation temperature and pressure increase. The vapor and liquid phases are becoming more similar as the saturation curve is followed to higher temperatures and pressures. At the critical point, the phases become identical. Notice in Fig. 1.4 that the two phases become identical at the highest temperature and pressure on the saturation curve, so this is the critical point. For a pure fluid, the critical temperature is the temperature at which vapor and liquid phases are identical on the saturation curve, and is given the notation Tc. The pressure at which this occurs is called the critical pressure, and is given the symbol Pc. A fluid above the critical temperature is often called supercritical.
The critical temperature and critical pressure are key characteristic properties of a fluid.
The second steam table organizes saturation properties indexed by pressure, so it is easiest to use when the pressure is known. Like the temperature table, vaporization values are presented. The table duplicates the saturated temperature table, that is, plotting the saturated volumes from the two tables would result in the same curves. The third steam table is the largest portion of the steam tables, consisting of superheated steam values. Superheated steam is vapor above its saturation temperature at the given pressure. The adjective "superheated" specifies that the vapor is above the saturation temperature at the system pressure. The adjective is usually used only where necessary for clarity. The difference between the system temperature and the saturation temperature, (T – Tsat), is termed the degrees of superheat. The superheated steam tables are indexed by pressure and temperature. The saturation temperature is provided at the top of each pressure table so that the super-heat may be quickly determined without referring to the saturation tables.
Superheat.
The fourth steam table has liquid-phase property values at temperatures below the critical temperature and above each corresponding vapor pressure. Liquid at these states is sometimes called subcooled liquid to indicate that the temperature is below the saturation temperature for the specified pressure. Another common way to describe these states is to identify the system as compressed liquid, which indicates that the pressure is above the saturation pressure at the specified temperature. The adjectives "subcooled" and "compressed" are usually only used where necessary for clarity. Notice by scanning the table that pressure has a small effect on the volume and internal energy of liquid water. By looking at the saturation conditions together with the general behavior of Fig. 1.4 in our minds, we can determine the state of aggregation (vapor, liquid, or mixture) for a particular state.
Subcooled, compressed.
Linear Interpolation
Since the information in the steam tables is tabular, we must interpolate to find values at states that are not listed. To interpolate, we assume the property we desire (e.g., volume, internal energy) varies linearly with the independent variables specified (e.g., pressure, temperature). The assumption of linearity is almost always an approximation, but is a close estimate if the interval of the calculation is small. Suppose we seek the value of volume, V, at pressure, P, and temperature, T, but the steam tables have only values of volume at P1 and P2 which straddle the desired pressure value as shown in Fig. 1.5. The two points represent values available in the tables and the solid line represents the true behavior. The dotted line represents a linear fit to the tabulated points.
)
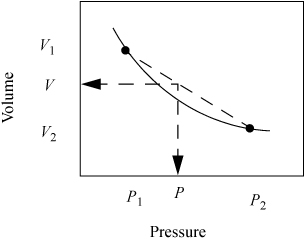
Figure 1.5 Illustration of linear interpolation.
Linear interpolation is a necessary skill for problem solving using thermodynamic tables.
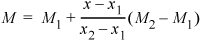
If we fit a linear segment to the tabulated points, the equation form is y = mx + b, where y is the dependent variable (volume in this case), x is the independent variable (pressure in this case), m is the slope m = Δy/Δx = (V2 – V1)/(P2 – P1), and b is the intercept. We can interpolate to find V without directly determining the intercept. Since the point we desire to calculate is also on the line with slope m, it also satisfies the equation m = Δy/Δx = (V – V1)/(P – P1). We can equate the two expressions for m to find the interpolated value of V at P.
There are two quick ways to think about the interpolation. First, since the interpolation is linear, the fractional change in V relative to the volume interval is equal to the fractional change in P relative to the pressure interval. In terms of variables:
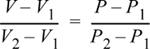
For example, (V – V1) is 10% of the volume interval (V2 – V1), when (P – P1) is 10% of (P2 – P1). We can rearrange this expression to find:
Equation 1.23
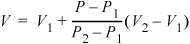
If we consider state "1" as the base state, we can think of this expression in words as
V = base V + (fractional change in P) · (volume interval size)
Another way to think of Eqn. 1.23 is by arranging it as:
Equation 1.24
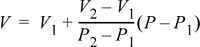
which in words is
V = base V + slope · (change in P from base state)
Note that subscripts for 1 and 2 can be interchanged in any of the formulas if desired, provided that all subscripts are interchanged. In general, interpolation can be performed for any generic property M such that (modifying Eqn. 1.23)
Equation 1.25
where M represents the property of interest (e.g., V) and x is the property you know (e.g., P).
Example 1.4. Interpolation
Find the volume and internal energy for water at: (a) 5 MPa and 325°C and (b) 5 MPa and 269°C.
Solution
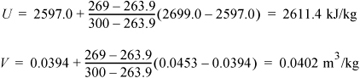
- Looking at the superheated steam table at 5 MPa, we find the saturation temperature in the column heading as 263.9°C; therefore, the state is superheated. Values are available at 300°C and 350°C. Since we are halfway in the temperature interval, by interpolation the desired U and V will also be halfway in their respective intervals (which may be found by the average values):
- U = (2699.0 + 2809.5)/2 = 2754.3 kJ/kg
- V = (0.0453 + 0.0520)/2 = 0.0487 m3/kg
- (b) For this state, we are between the saturation temperature (263.9°C) and 300°C, and we apply the interpolation formula:
Double Interpolation
Occasionally, we must perform double or multiple interpolation to find values. The following example illustrates these techniques.
We also may need to interpolate between values in different tables, like the saturated tables and superheated tables. This is also straightforward as shown in the following example.
Example 1.6. Double interpolation using different tables
Find the internal energy for water at 0.12 MPa and 110°C.
Solution
We found in Example 1.3 on page 25 that this is a superheated state. From the super-heated table we can interpolate to find the internal energy at 110°C and 0.1 MPa:
U = 2506.2 + 0.2 · (2582.9 – 2506.2) = 2521.5 kJ/kg
At 0.2 MPa, 110°C is not found in the superheated table because the saturation temperature is 120.3°C, so the values at this pressure cannot be used. Therefore, we can find the desired internal energy by interpolation using the value above and the saturation value at 110°C and 0.143 MPa from the saturation temperature table:

Computer-Aided Interpolation
Occasionally, interpolation must be performed when the T and P are both unknown. Computers or spreadsheets can be helpful as shown in the next example.
Example 1.7. Double interpolation using Excel
Steam undergoes a series of state changes and is at a final state where U = 2650 kJ/kg and V = 0.185 m3/kg. Find the T and P.
 Example use of Excel for double interpolation.
Solution
Scanning the steam tables, the final state is in the range 1.0 MPa < P < 1.2 MPa, 200°C < T < 250°C. The final state requires a double interpolation using U and V. One easy method is to set up the table in Excel. In each of the tables below, the pressure interpolation is performed first in the top and bottom rows, dependent on the pressure variable in the top of the center column, which can be set at any intermediate pressure to start. The temperature interpolation is then entered in the center cell of each table using the temperature variable. The formulas in both tables reference a common temperature variable cell and a common pressure variable cell. Solver is started and T and P are adjusted to make U = 2650 kJ/kg subject to the constraint V = 0.185 m3/kg. (See Appendix A for Solver instructions.) The converged result is shown at T = 219.6°C and P = 1.17 MPa.
|
Pf |
||||
|
U(kJ/kg) table |
P = 1 MPa |
1.164752 |
P = 1.2 MPa |
|
|
T = 200°C |
2622.2 |
2614.539 |
2612.9 |
|
|
Tf |
219.4486791 |
2650 |
||
|
T = 250°C |
2710.4 |
2705.705 |
2704.7 |
|
V(m3/kg) table |
P = 1 MPa |
P = 1.2 MPa |
||
|
T = 200°C |
0.2060 |
0.175768 |
0.1693 |
|
|
0.185 |
||||
|
T = 250°C |
0.2327 |
0.199502 |
0.1924 |
Extrapolation
Occasionally, the values we seek are not conveniently between points in the table and we can apply the "interpolation" formulas to extrapolate as shown in Fig. 1.6. In this case, T lies outside the interval. Extrapolation is much less certain than interpolation since we frequently do not know "what curve lies beyond" that we may miss by linear approximation. The formulas used for extrapolation are identical to those used for interpolation. With the steam tables, extrapolation is generally not necessary at normal process conditions and should be avoided if possible.
)
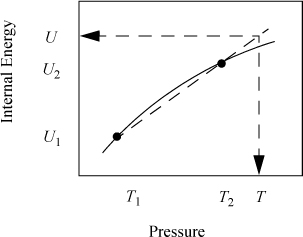
Figure 1.6 Illustration of linear extrapolation.
Phase Equilibrium and Quality
Along the saturation curve in Fig. 1.4 on page 23, there is just one degree of freedom (F = C – P + 2 = 1 – 2 + 2 = 1). If we seek saturation, we may choose either a Tsat or a Psat, and the other is determined. The vapor pressure increases rapidly with temperature as shown in Fig. 1.7. A plot of ln Psat versus is 1/Tsat nearly linear and over large intervals, so for accurate interpolations, vapor pressure data should be converted to this form before interpolation. However, the steam tables used with this text have small enough intervals that direct interpolation can be applied to Psat and Tsat without appreciable error.
)
)
Figure 1.7 P-T representation of real fluid behavior. Note that only vapor and liquid behavior is shown in Fig. 1.4 on page 23.
The saturation volume values of the steam tables were used to generate the phase diagram of Fig. 1.4 on page 23. Note that as the critical point is approached, the saturation vapor and liquid values approach one another. The same occurs for internal energy and two properties that will be used in upcoming chapters, enthalpy, H, and entropy, S. When a mixture of two phases exists, we must characterize the fraction that is vapor, since the vapor and liquid property values differ significantly.
The mass percentage that is vapor is called the quality and given the symbol q. The properties V, U, H, and S, may be represented with a generic variable M. The overall value of the state variable M is
Quality is the vapor mass percentage of a vapor/liquid mixture.
Equation 1.26
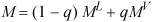
which may be rearranged as
M = ML + q(MV – ML)
but (MV – ML) is just ΔMvap and for internal energy, enthalpy, and entropy, it is tabulated in columns of the saturation tables. The value of overall M is
Equation 1.27
Look carefully at Eqn. 1.27 in comparison with Eqn. 1.25; it may be helpful to recognize a quality calculation as an interpolation between saturated liquid and saturated vapor. Two examples help demonstrate the importance of quality calculations.
Example 1.9. Constant volume cooling
Steam is initially contained in a rigid cylinder at P = 30 MPa and V = 102.498cm3/mole. The cylinder is allowed to cool to 300°C. What is the pressure, quality, and overall internal energy of the final mixture?
Solution
The overall mass volume is V = 102.498cm3-mole–1 · 10–6(m3/cm3)/(18.02E-3kg/mole) = 0.01747 m3/kg. From the superheated steam table at 30 MPa, the initial temperature is 900°C. When the cylinder is cooled to 300°C, the path is shown in Fig. 1.8 below. You should notice that there is no pressure in the superheated steam tables that provides a volume of V = 0.01747 m3/kg. Look hard, they are all too large. (Imagine yourself looking for this on a test when you are in a hurry.) Now look in the saturated steam tables at 300°C. Notice that the saturated vapor volume is 0.0217 m3/ kg. Since that is higher than the desired volume, but it is the lowest vapor volume at this temperature, we must conclude that our condition is somewhere between the saturated liquid and the saturated vapor at a pressure of 8.588 MPa. (When you are in a hurry, it is advisable to check the saturated tables first.) Using the saturation volumes at 300°C condition to find q,
)
)
Figure 1.8 P-V-T behavior of water illustrating a quality calculation.
0.01747 = 0.001404 + q (0.0217 – 0.001404) m3/kg
which leads to q = (0.01747 – 0.001404)/(0.0217 – 0.001404) = 0.792. The overall internal energy is
U = 1332.95 + 0.792 · 1230.67 = 2308 kJ/kg