- 1.1. Introduction
- 1.2. The Magnitude of the Sustainability Challenge
- 1.3. Energy
- 1.4. Materials Use
- 1.5. Environmental Emissions
- 1.6. Summary
- Problems
- References
This chapter is from the book
This chapter is from the book
This chapter is from the book
1.5. Environmental Emissions
Environmental emissions and their impacts are global, regional, and local in scope. They also act on timescales ranging from hours to decades. While there are many types of environmental emissions, in this section atmospheric emissions and their impacts will be used to provide an example of the different spatial and temporal scales associated with environmental impacts. Readers seeking additional information on environmental emissions and their impacts can find more information in the U.S. Environmental Protection Agency’s Report on the Environment (2008).
On a global scale, man-made (anthropogenic) greenhouse gases, such as chlorofluorocarbon (CFC) refrigerants, methane, nitrous oxide, and carbon dioxide, are implicated in global warming and climate change. These emissions have the potential to alter global weather patterns and may cause dislocation of people and animal species. On a regional scale, hydrocarbons released into the air, in combination with nitrogen oxides originating from combustion processes, can lead to air quality degradation over urban areas and over regions extending hundreds to thousands of kilometers. On a local scale, emissions of certain toxic air pollutants can lead to neighborhood-level concerns. Temporal scales of these atmospheric impacts also vary. For example, greenhouse gases typically have atmospheric lifetimes on the order of several decades. Other releases, such as those that impact urban air quality, can have their primary impact over a period of hours or days.
1.5.1. Ozone Depletion in the Stratosphere
There is a distinction between “good” and “bad” ozone (O3) in the atmosphere. Tropospheric ozone, created by photochemical reactions between nitrogen oxides and hydrocarbons at the Earth’s surface, is an important component of smog. A potent oxidant, it causes lung irritation that can lead to serious lung damage, and it damages crops and trees. Stratospheric ozone, found in the upper atmosphere, performs a vital and beneficial function for all life on Earth by absorbing harmful ultraviolet radiation. The potential destruction of this stratospheric ozone layer is therefore of concern and represents a global environmental challenge.
The stratospheric ozone layer is a region in the atmosphere between 6 and 30 miles (10–50 km) above ground level in which the ozone concentration is elevated compared to all other regions of the atmosphere. In this low-pressure region, the concentration of O3 can be as high as 10 parts per million (10 ppm, 10 out of every 1,000,000 molecules). In contrast, ozone concentrations at ground level that exceed 100 parts per billion (100 ppb, 100 out of every 1,000,000,000 molecules) are considered a threat to human health. Ozone is formed at altitudes between 25 and 35 km in the tropical regions near the equator where solar radiation is consistently strong throughout the year. Because of atmospheric motion, ozone migrates to the polar regions, and its highest concentration is found there at about 15 km in altitude. Stratospheric ozone concentrations have declined over the past 30 years. The potential negative impact on human health and on a variety of plants has caused a considerable amount of concern among scientific and medical personnel worldwide. An excess of UV radiation can cause skin cancer in humans and damage to vegetation.
Ozone equilibrates in the stratosphere as a result of a series of natural formation and destruction reactions that are initiated by solar energy. The natural cycle of stratospheric ozone chemistry is being altered by the introduction of man-made chemicals. Three chemists, Mario Molina and Sherwood Rowland of the University of California, Irvine, and Paul Crutzen of Germany, received the 1995 Nobel Prize for chemistry for their discovery that CFCs take part in the destruction of atmospheric ozone. CFCs are highly stable chemical structures composed of carbon, chlorine, and fluorine. One important example is trichlorofluoromethane, CCl3F, or CFC-11.
CFCs reach the stratosphere because of their chemical properties: high volatility, low water solubility, and persistence in the lower atmosphere. In the stratosphere, they are photo-dissociated to produce chlorine atoms, which then catalyze the destruction of ozone (Molina and Rowland, 1974):
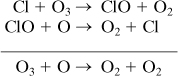
The chlorine atom is not destroyed in the reaction cycle and can cause the destruction of thousands of molecules of ozone before forming HCl by reacting with hydrocarbons. The HCl eventually precipitates from the atmosphere. A similar mechanism also applies to bromine, except that bromine is an even more potent ozone-destroying compound. Figure 1-9 summarizes the major steps in the environmental cause-and-effect chain for ozone-depleting substances.
)
)
Figure 1-9. Ozone-depleting chemical emissions and the major steps in the environmental cause-and-effect chain
CFCs were introduced in the 1930s and were used primarily as refrigerants and solvents. Large-scale use started in about 1950. Following the work of Molina, Rowland, and Crutzen in the 1970s, establishing the link between CFCs and stratospheric ozone depletion, and the discovery of an ozone hole over Antarctica in the mid-1980s, international agreements (protocols) on the use of CFCs were initiated. Use has been decreasing since the Montreal Protocol of 1987. This, and subsequent international agreements, instituted a phaseout of ozone-depleting chemicals. As shown in Figure 1-10, in some applications, CFCs have been replaced by hydrochlorofluorocarbons (HCFCs), which have shorter atmospheric lifetimes.
)
)
Figure 1-10. Recent trends in the production (in thousands of metric tons per year) of CFCs and HCFCs (AFEAS, 2009)
The partial destruction of the ozone layer in the stratosphere by the use and emission of CFCs is perhaps the best-documented example of the impact that human activities can have on the global environment, and the ability of nations to collectively respond to the challenge. Figures 1-10 and 1-11 show recent trends in the production of several CFCs and their remote tropospheric concentrations resulting from releases. The growth in accumulation of CFCs in the environment has been halted as a result of international agreements.
)
)
Figure 1-11. Recent trends in the tropospheric concentration of CFCs and solvents and scenarios for projected future concentrations (WMO is the World Meteorological Organization) (NOAA, 2010)
1.5.2. Global Warming
The atmosphere allows visible radiation from the sun to pass through without significant absorption of energy. Some solar radiation reaching the surface of the Earth is absorbed, heating the land and water. Infrared radiation is emitted from the Earth’s surface, but certain gases in the atmosphere absorb this infrared radiation and redirect a portion back to the surface, thus warming the planet and making life, as we know it, possible. This process is often referred to as the greenhouse effect. The surface temperature of the Earth will rise until a radiative equilibrium is achieved between the rate of solar radiation absorption and the rate of infrared radiation emission (see Problem 7 at the end of the chapter). Human activities, such as fossil fuel combustion, deforestation, agriculture, and large-scale chemical production, have measurably altered the composition of gases in the atmosphere. The Intergovernmental Panel on Climate Change (IPCC, 2007a,b) has concluded that these alterations have led to a warming of the Earth-atmosphere system. Figure 1-12 summarizes the major links in the chain of environmental cause and effect for the emission of greenhouse gases.
)
)
Figure 1-12. Greenhouse gas emissions and the major environmental cause-and-effect chain
Table 1-1 lists the most important greenhouse gases along with their anthropogenic (man-made) sources, emission rates, concentrations, residence times in the atmosphere, relative radiative forcing efficiencies, and estimated contribution to global warming. The primary greenhouse gases are water vapor, carbon dioxide, methane, nitrous oxide, CFCs, and tropospheric ozone. Water vapor is the most abundant greenhouse gas, but the concentration of water vapor in the atmosphere is not significantly changed by anthropogenic emissions of water. Carbon dioxide contributes significantly to global warming because of its high emission rate, stability, and infrared absorptivity. The major factors contributing to the global-warming potential of a chemical are infrared absorptive capacity and residence time in the atmosphere. Gases with very high absorptive capacities and long residence times can cause significant global warming even though their concentrations are extremely low. A good example of this phenomenon is the CFC class of chemicals, which are, on a pound-for-pound basis, more than 1000 times more effective as greenhouse gases than carbon dioxide.
Table 1-1. Greenhouse Gases and Global Warming Contribution
Gas |
Source (Natural and Anthropogenic) |
Estimated Anthropogenic Emission Rate |
Preindustrial Global Concentration |
Approximate Current Concentration |
Estimated Residence Time in Atmosphere |
Radiative Forcing Efficiency over 100 Years (CO2 = 1) |
Estimated Contribution to Radiative Forcing (W/m2) |
Carbon dioxide (CO2) |
Fossil fuel combustion, deforestation |
38 Gt/yr (1012 kg/yr) |
280 ppm |
390 ppm |
50–200 yrs |
1 |
1.5–1.8 |
Methane (CH4) |
Anaerobic decay (wetlands, landfills, rice paddies), ruminants, termites, natural gas, coal mining, biomass burning |
0.3 Gt/yr |
0.8 ppm |
1.8 ppm |
10 yrs |
25 |
0.43–0.53 |
Nitrous oxide (N2O) |
Estuaries and tropical forests, agricultural practices, deforestation, land clearing, low-temperature fuel combustion |
0.01 Gt/yr |
0.385 ppm |
0.32 ppm |
140–190 yrs |
298 |
0.14–0.18 |
Chlorofluorocarbons |
Refrigerants, air conditioners, foam blowing agents, aerosol cans, solvents |
<0.0005 Gt/yr |
0 |
0.0004–0.001 ppm |
65–110 yrs |
4750 (CFC-11) |
0.31–0.37 |
Tropospheric ozone (O3) |
Photochemical reactions between VOCs and NOx from transportation and industrial sources |
Not emitted directly |
NA |
0.022 ppm |
Hours–days |
2000 |
0.25–0.65 |
Source: Phipps, 1996; IPCC 2007a, b |
|||||||
For the past five decades, measurements of the accumulation of carbon dioxide in the atmosphere have been taken at the Mauna Loa Observatory in Hawaii, a location far removed from most human activity that might generate carbon dioxide. Based on the current level of CO2 of 390 ppm, levels of CO2 are increasing at the rate of 0.5% per year (from about 320 ppm in 1960). Atmospheric concentrations of other greenhouse gases have also risen. Methane has increased from about 700 ppb in preindustrial times to 1790 ppb in 2009, and N2O rose from 275 to 320 ppb over the same period. While it is clear that atmospheric concentrations of carbon dioxide and other global-warming gases are increasing, there is significant uncertainty regarding the magnitude of the effect on climate that these concentration changes might induce (interested readers should consult the reports of the IPCC; see the references at the end of the chapter). At the time of the writing of this book, a variety of international protocols have been introduced with the goal of reducing emissions of global warming gases.
1.5.3. Regional and Local Air Quality
Air pollution at regional and local scales arises from a number of sources, including stationary, mobile, and area sources. Stationary sources include factories and other manufacturing processes. Mobile sources are automobiles, trucks, other transportation vehicles, mobile construction equipment, and recreational vehicles such as snowmobiles and watercraft. Area sources are emissions associated with activities that are not considered mobile or stationary sources and that are associated with human activity. Examples of area sources include emissions from lawn and garden equipment and residential heating. Pollutants can be classified as primary, those emitted directly to the atmosphere, or secondary, being formed in the atmosphere after emission of precursor compounds. Photochemical smog (the term originated as a contraction of smoke and fog) is an example of secondary pollution that is formed from the emission of volatile organic compounds (VOCs) and nitrogen oxides (NOx), the primary pollutants. Air quality problems are closely associated with combustion processes occurring in the industrial and transportation sectors of the economy. In addition, hazardous air pollutants, including chlorinated organic compounds and heavy metals, are emitted in large enough quantities to be of concern. Figure 1-13 shows the main environmental cause-and-effect chain leading to the formation of smog.
)
)
Figure 1-13. Environmental cause-and-effect chain for photochemical smog formation
Criteria Air Pollutants
Air pollutants are categorized in a variety of ways in U.S. regulations. One category is referred to as criteria air pollutants. The Clean Air Act Amendments of 1970 charged the United States Environmental Protection Agency (EPA) with identifying those air pollutants that most affect public health and welfare, and with setting maximum allowable ambient air concentrations (criteria) for these air pollutants. Six chemical species or groups of species (Table 1-2) have both primary and secondary standards that make up the National Ambient Air Quality Standards (NAAQS). The primary standards are intended to protect the public health with an adequate margin of safety. The secondary standards are meant to protect public welfare, such as damage to crops, vegetation, and ecosystems or reductions in visibility.
Table 1-2. Criteria Pollutants and the National Ambient Air Quality Standards
Primary Standard (Human-Health-Related) |
Secondary (Welfare-Related) |
|||
Pollutant |
Type of Average |
Concentrationa |
Type of Average |
Concentration |
CO |
8-hourb |
9 ppm (10 mg/m3) |
No Secondary Standard |
|
1-hourb |
35 ppm (40 mg/m3) |
No Secondary Standard |
||
Pb |
Maximum quarterly average |
1.5 μg/m3 |
Same as Primary Standard |
|
Rolling 3-month average |
0.15 μg/m3 |
|||
NO2 |
Annual arithmetic mean |
0.053 ppm (100 μg/m3) |
Same as Primary Standard |
|
1-hourc |
100 ppb |
|||
O3 |
1-hourd |
0.12 ppm |
Same as Primary Standard |
|
8-houre |
0.075 ppm |
Same as Primary Standard |
||
PM10 |
24-hourf |
150 μg/m3 |
Same as Primary Standard |
|
PM2.5 |
Annual arithmetic meang |
15 μg/m3 |
Same as Primary Standard |
|
24-hourh |
35 μg/m3 |
Same as Primary Standard |
||
SO2 |
Annual arithmetic mean |
0.03 ppm (80 μg/m3) |
3-hourb |
0.5 ppm (1300 μg/m3) |
24-hourb |
0.14 ppm (365 μg/m3) |
|||
1-houri |
75 ppb |
None |
||
Source: Adapted from U.S. EPA (2011). |
||||
Since the establishment of the NAAQS, overall emissions of criteria pollutants in the United States have decreased even as population and economic activity have increased (a source of data is the National Air Quality Emission Trends Report, issued annually [U.S. EPA, 2010a]). Even with such improvements, in 2010 more than 100 million people in the United States lived in locations with air quality concentrations above the NAAQS (U.S. EPA, 2010a). The following sections briefly describe the criteria pollutants and their health effects.
NOx, Hydrocarbons, and VOCs—Ground-Level Ozone
Ground-level ozone is one of the most pervasive and intractable air pollution problems in the United States. This “bad” ozone, created at or near ground level (tropospheric ozone), should again be differentiated from the “good” or stratospheric ozone that protects the surface of the planet from UV radiation (see Section 1.5.1). High ground-level ozone concentrations are exacerbated by certain physical and atmospheric factors. High-intensity solar radiation, low prevailing wind speed (low dilution), atmospheric inversions, and proximity to mountain ranges or coastlines (stagnant air masses) all contribute to photochemical smog formation. Human exposure to ozone can result in both acute (short-term) and chronic (long-term) health effects. The high reactivity of ozone makes it a strong lung irritant, even at low concentrations. Ground-level ozone also affects crops and vegetation when it enters the stomata of leaves and disrupts photosynthesis. Finally, ozone as an oxidant affects many materials such as painted surfaces and rubber.
Ground-level ozone is created in the atmosphere by precursor contaminants: VOCs and NOx (primarily NO and NO2). The oxides of nitrogen along with sunlight cause ozone formation, but the role of VOCs is to accelerate and enhance the accumulation of O3.
Oxides of nitrogen (NOx) are formed in high-temperature industrial and transportation combustion processes. The health effects of short-term exposure to NO2 (less than 3 hours at high concentrations) are increases in respiratory illness in children and impaired respiratory function in individuals with preexisting respiratory problems. Between 1980 and 2008, NOx emissions have decreased by 40% in the United States (U.S. EPA, 2010a).
The VOC sources of most concern for smog formation are those that are easily oxidized in the atmosphere by the hydroxyl radical. Major sources of hydrocarbons are the chemical and oil-refining industries and motor vehicles. It should be noted that there are natural (biogenic) sources of VOCs, such as isoprene and monoterpenes, that can contribute significantly to regional hydrocarbon emissions and ground-level ozone levels. Man-made emissions of VOCs decreased by 47% in the United States between 1980 and 2008 (U.S. EPA, 2010a).
Carbon Monoxide (CO)
CO is a colorless, odorless gas formed primarily as a by-product of incomplete combustion. The major health hazard posed by CO is its ability to bind with hemoglobin in the bloodstream and thereby reduce the oxygen-carrying ability of the blood. Transportation sources account for the bulk of total U.S. CO emissions. Ambient CO concentrations have decreased significantly in the past three decades, primarily because of vehicle exhaust emission controls and the introduction of oxygenated fuel additives that promote more complete combustion. Areas with high traffic congestion generally have high ambient CO concentrations. High localized and indoor CO levels can come from cigarettes (secondhand smoke), wood-burning fireplaces, and kerosene space heaters.
Lead
Lead in the atmosphere is primarily found in fine particles, up to 10 μ in diameter, which can remain suspended in the atmosphere for significant periods of time. Tetraethyl lead ((CH3CH2)4-Pb) was used as an octane booster and antiknock compound for many years before the introduction of automotive catalytic converters, driven by provisions of the Clean Air Act of 1970, forced the phaseout of all lead additives. The dramatic decline in lead concentrations and emissions due to the phaseout of lead additives in gasoline has been one of the most important environmental improvements of the past 30 years.
Particulate Matter (PM)
Particulate matter is the general term for micron-scale solid or liquid-phase (aerosols) particles suspended in air. PM exists in a variety of sizes ranging from a few Angstroms to several hundred micrometers. Particles are either emitted directly from primary sources or are formed in the atmosphere by gas-phase reactions (secondary aerosols). Since particle size determines how deeply into the lung a particle is inhaled, there are two NAAQS for PM, PM2.5 and PM10. Particles smaller than 2.5 μm are called “fine” and are composed largely of inorganic salts (primarily ammonium sulfate and nitrate), sootlike carbon, organic species, and trace metals. Fine PM can deposit deep in the lung where removal is difficult. Particles larger than 10 μm are called “coarse” particles and are composed largely of suspended dust. Coarse PM tends to deposit in the upper respiratory tract, where removal is more easily accomplished. As with the other criteria pollutants, PM10 concentrations and emission rates have decreased because of pollution control efforts. Coarse particle inhalation is an irritant in upper respiratory difficulties. Fine particle inhalation can decrease lung functions, cause chronic bronchitis, and lead to premature mortality. Inhalation of specific toxic substances such as asbestos, coal mine dust, or textile fibers is now known to cause specific associated cancers (asbestosis, black lung cancer, and brown lung cancer, respectively).
An additional environmental effect of PM is limited visibility in many parts of the United States, including some National Parks. Also, nitrogen and sulfur containing particles are deposited, often with precipitation, increasing acidity levels in soil and water bodies and causing changes in soil nutrient balances and damage or death to aquatic organisms and ecosystems. PM deposition also causes soiling and corrosion of cultural monuments and buildings, especially those that are made of limestone.
SO2, NOx, and Acid Deposition
Sulfur dioxide (SO2) is the most commonly encountered of the sulfur oxide (SOx) gases and is formed upon combustion of sulfur-containing solid and liquid fuels (primarily coal and oil). SOx emissions are generated by transportation sources and electric utilities, metal smelting, and other industrial processes. Nitrogen oxides (NOx) are also produced in combustion reactions; however, the origin of most of the nitrogen is the combustion air rather than the fuel. After being emitted, SO2 and NOx can be transported over long distances and are transformed in the atmosphere by gas-phase and aqueous-phase reactions to acid components (H2SO4 and HNO3). The acid is deposited on the Earth’s surface as either dry deposition of aerosols during periods of no precipitation or wet deposition of acid-containing rain or other precipitation. There are also natural emission sources for both sulfur and nitrogen-containing compounds that contribute to acid deposition. Water in equilibrium with CO2 in the atmosphere at a concentration of 390 ppm has a pH of 5 to 6. When natural sources of sulfur and nitrogen acid rain precursors are considered, the “natural” background pH of rain is expected to be about 5.0. As a result of these considerations, “acid rain” is defined as having a pH less than 5.0.
The main sources of SO2 emissions are from non-transportation fuel combustion, industrial processes, and transportation. SO2 concentrations and emissions decreased by approximately 60% between 1980 and 2008 (U.S. EPA, 2010a).
Emissions are expected to continue to decrease as a result of implementing the Acid Rain Program established by the EPA under the Clean Air Act. The goal of this program is to decrease acid deposition significantly by controlling SO2 and emissions from utilities, smelters, and sulfuric acid manufacturing plants and reducing the average sulfur content of fuels for transportation and for industrial, commercial, and residential boilers.
There are a number of health and environmental effects of SO2, NOx, and acid deposition. SO2 is absorbed readily into the moist tissue lining the upper respiratory system, leading to irritation and swelling of this tissue and airway constriction. Long-term exposure to high concentrations can lead to aggravation of cardiovascular disease and lung disease. Acid deposition causes acidification of surface water, especially in regions of high SO2 concentrations and low buffering and ion exchange capacity of soil and surface water. Acidification of water can cause harm to fish populations, by mobilization and exposure to heavy metals. Excessive exposure of plants to SO2 decreases plant growth and yield and decreases the number and variety of plant species in a region.
Air Toxics
Hazardous air pollutants (HAPs), or air toxics, are airborne pollutants that are known to have adverse human health effects, such as cancer. Currently, more than 180 chemicals are identified on the Clean Air Act list of HAPs. Examples of air toxics are heavy metals like mercury and hexavalent chromium; and organic chemicals such as benzene, perchloroethylene (PERC), 1,3-butadiene, dioxins, and polycyclic aromatic hydrocarbons (PAHs).
The Clean Air Act defined a major source of HAPs as a stationary source that has the potential to emit 10 tons per year of any one HAP on the list or 25 tons per year of any combination of HAPs. The Clean Air Act prescribes a very high level of pollution control technology for HAPs called MACT (Maximum Achievable Control Technology). Small area sources, such as dry cleaners, emit lower HAP tonnages but taken together are a significant source of HAPs. Emission reductions can be achieved by changes in work practices, such as material substitution and other pollution prevention strategies.
HAPs affect human health via inhalation or ingestion routes. Some HAPs can accumulate in the tissue of fish, and the extent of the contaminant increases up the food chain to humans. Some of these persistent and bioaccumulative chemicals are known or suspected carcinogens.
1.5.4. Summary of Air Quality
Air quality issues provide an example of the complexity of environmental emissions and impacts. Spatial scales range from local to global. Temporal scales range from hours to decades. The chemical species involved are varied. Phenomena are nonlinear. Pollutants in the atmosphere may not stay in the atmosphere; they can be deposited onto land and water, linking air quality to water quality and ecosystem health. The same characteristics apply to many other environmental emissions and impacts. The remainder of this section will not describe these emissions and impacts at the same level of detail as the atmospheric emissions and impacts. This is not an indication of lesser importance. Instead, it is merely a reflection of the need to keep this introduction concise. Readers interested in learning more about other emissions and impacts are referred to the U.S. EPA’s Report on the Environment (2008).
1.5.5. Water Quality
The availability of freshwater in sufficient quantity and purity is vitally important in meeting human domestic and industrial needs. Though 70% of the Earth’s surface is covered with water, the vast majority exists in oceans and is too saline to meet the needs of domestic, agricultural, or other uses. Of the total 1.36 billion km3 of water on Earth, 97% is ocean water, 2% is locked in glaciers, 0.31% is stored in deep groundwater reserves, and 0.32% is readily accessible freshwater (4.2 million km3). Freshwater is continually replenished by the action of the hydrologic cycle. Surface water evaporates to form clouds; precipitation returns water to the Earth’s surface, recharging the groundwater by infiltration through the soil; and rivers return water to the ocean to complete the cycle. In the United States, freshwater use is divided among agricultural irrigation, electricity generation, public supply, industry, and rural uses (Solley et al., 1993). Groundwater resources meet about 20% of U.S. water requirements, with the remainder coming from surface water sources.
Contamination of surface and groundwater originates from two categories of pollution sources. Point sources are entities that release relatively large quantities of wastewater at a specific location, such as industrial discharges and sewer outfalls. Non-point sources include all of the remaining discharges, such as agricultural and urban runoff, septic tank leachate, and mine drainage.
Besides the industrial and municipal sources we typically think of in regard to water pollution, other significant sources of surface and groundwater contamination are from agricultural and forestry activity. Contaminants originating from agricultural activities include pesticides; inorganic nutrients such as ammonium, nitrate, and phosphate; and leachate from animal waste. Forestry practices involve disruption of the soil surface from road building and the movement of heavy machinery on the forest floor. This activity increases erosion of topsoil, especially on steep forest slopes. The resulting additional suspended sediment in streams and rivers can lead to light blockage, reduced primary production in streams, destruction of spawning grounds, and habitat disruption of fisheries.
Transportation-related sources also contribute to water pollution, especially in coastal regions where shipping is most active. The 1989 Exxon Valdez oil spill in Prince William Sound in the state of Alaska and the 2010 Deepwater Horizon oil rig blowout in the Gulf of Mexico are well-known cases that coated shorelines with crude oil over a vast area. However, routine discharges of petroleum from oil tanker operations in 2002 were on the order of 8 million barrels/yr (NRC, 2002), which is an annual volume approximately 32 times higher than the Exxon Valdez spill. Transportation activities can also be a source of non-point pollution as runoff from roads carries oil, heavy metals, and salt into nearby streams.
1.5.6. Wastes in the United States
There is no single source of national industrial waste data in the United States. Instead, the national industrial waste generation, treatment, and release picture is a composite derived from multiple sources of data. A major source of industrial waste data is the EPA, which compiles various national inventories in response to legislative statutes. A sampling of the many laws requiring data collection include the Clean Air Act, Resource Conservation and Recovery Act (RCRA), Superfund Amendments and Reauthorization Act (SARA), and the Emergency Planning and Community Right-to-Know Act (EPCRA). In addition to these federal government sources of data, private industry is involved in data compilation activities, for example, the American Chemistry Council and the American Petroleum Institute. Following is a list of a number of national industrial waste databases (U.S. DOE, 1991). Because of the many inventories and the fact that more than one data source (inventory) might contain the same waste data, the assembly of the national waste picture is difficult. However, from these data sources it is possible to identify the major industrial sectors involved and the magnitude of their contributions.
- Non-Hazardous Solid Waste
- U.S. Environmental Protection Agency. 1988. Report to Congress: Solid Waste Disposal in the United States, Volumes I and II. EPA/530-SW-88-011 and EPA/530-SW-88-011B.
- Criteria Air Pollutants
- U.S. EPA, Office of Air Quality Planning and Standards. Air Trends. www.epa.gov/airtrends.
- U.S. EPA, Office of Air Quality Planning and Standards. National Air Pollutant Emission Estimates. Research Triangle Park, NC.
- Hazardous Waste (Air Releases, Wastewater, and Solids)
- Biennial Report System (BRS); available through TRK NET, Washington, DC. U.S. EPA, Office of Solid Waste. National Biennial Report of Hazardous Waste Treatment, Storage, and Disposal Facilities Regulated under RCRA. Washington, DC.
- U.S. EPA, Office of Solid Waste. Report to Congress on Special Wastes from Mineral Processing. Washington, DC.
- U.S. EPA, Office of Solid Waste. Report to Congress: Management of Wastes from the Exploration, Development, and Production of Crude Oil, Natural Gas, and Geothermal Energy, Vol. 1, Oil and Gas. Washington, DC.
- Toxics Chemical Release Inventory (TRI); available through National Library of Medicine, Bethesda, MD, and RTK NET, Washington, DC. Toxics Release Inventory: Public Data Release. www.epa.gov/tri.
- U.S. EPA, Office of Water Enforcement and Permits. Permit Compliance System. Washington, DC.
- Economic Aspects of Pollution Abatement
- U.S. Department of Commerce, Bureau of the Census. Manufacturers’ Pollution Abatement Capital Expenditures and Operating Costs. Washington, DC.
- U.S. Department of the Interior, Bureau of Mines. Minerals Yearbook, Vol. 1: Metals and Minerals. Washington, DC.
- U.S. Department of Commerce, Bureau of the Census. Census Series: Agriculture, Construction Industries, Manufacturers-Industry, Mineral Industries. Washington, DC.
Non-hazardous industrial waste represents the largest contribution to national industrial waste generation. Roughly 12 billion tons of non-hazardous waste is generated and disposed of by U.S. industry (Allen and Rosselot, 1997; U.S. EPA, 1988a,b). That amount is over 200 pounds of industrial waste per person each day. This amount is about 60 times higher than the rate of waste generation by households in the United States (municipal solid waste). The largest industrial contributors to nonhazardous waste are manufacturing industries (7600 million tons/yr), oil and gas production (2095–3609 million tons/yr), and the mining industry (>1400 million tons/yr). Contributors of lower amounts are electricity generators (fly ash and flue-gas desulfurization waste), construction waste, hospital infectious waste, and waste tires.
Hazardous waste is defined under the provisions of the RCRA as residual materials having greater than a threshold value of ignitability, reactivity, toxicity, or corrosivity. Once this material is designated as hazardous, the costs of managing, treating, storing, and disposing of it increase dramatically. The rate of industrial hazardous waste generation in the United States is approximately 750 million tons/yr (Baker and Warren, 1992; Allen and Rosselot, 1997). This rate is 1/16 the rate of non-hazardous waste generation by industry. Furthermore, hazardous waste contains over 90% by weight of water, having only a relatively minor fraction of hazardous components. Therefore, the rate of generation of hazardous components in waste by industry is likely about 10 to 100 million tons/yr, though there is significant uncertainty in the exact amount because of differing definitions of hazardous waste. More than 90% of hazardous wastes are managed on-site at the facilities that generated them, and most of the hazardous waste is managed using wastewater treatment. Relatively little recycling and recovery of hazardous waste components occur in the current distribution of management methods.
Toxic releases from industrial operations are a subset of industrial wastes, but because of their potential to adversely affect human health and the health of the environment, they are reported separately. Approximately 650 of the thousands of chemicals used in commerce are reported through the U.S. EPA in the Toxic Chemi-cal Release Inventory (TRI). Manufacturing operations and certain federal facilities are required to report to the TRI. Facilities must report releases of toxic chemicals to the air, water, and soil, as well as transfers to off-site recycling or treatment, storage, and disposal facilities. The release rate estimates include only the toxic components of any waste stream; thus water and other inerts are not included, in contrast with the industrial hazardous waste reporting system. The total releases and transfers reported to the TRI in 2008 (U.S. EPA, 2010b) were 2 million tons. Details of the releases are available from TRI Trends, published by the U.S. EPA (2010b).